Virtual Flood
Game Overview
The purpose of the Virtual Flood game is to see whether the provision of probabilistic information leads to improved decisions. You are the decision-maker. You will be given a set of deterministic forecasts and then a set of probabilistic forecasts and you must decide on whether to issue a warning for each. You will compare the two sets of outcomes using a contingency table. The data used in the exercise are synthetic.
The exercise has three parts
- Task 1: You will be given a set of deterministic forecasts and you must decide whether to issue a warning for each.
- Task 2: You will be given a set of forecasts with probabilistic information and, again, and you must decide whether to issue a warning for each.
- Task 3: You will compare the skill scores under the deterministic and probabilistic cases to address the question: Do probabilistic forecasts result in better decisions?
The exercise uses contingency tables and skill scores to assess your forecasts, before starting please read here.
You will learn
- How to construct a contingency table
- How to calculate skills scores
- The basic concepts of probabilistic forecasting
The game is played in an Excel spreadsheet, please download and play the Virtual Flood Game
Task 1: Deterministic Forecasts
A deterministic forecast does not include an expression of the associated uncertainty.
An overview of the deterministic forecasting system used in this game is provided in Figure 1. The observed river flows are available for the first 18 hours (black line). A 6-hour forecast is provided (grey line). A flood greater than 200 m3/s will result in economic damage. Decide on the basis of the forecast whether you would issue a warning. (Note, this could equally apply to the runoff into an inner river in our study area.)
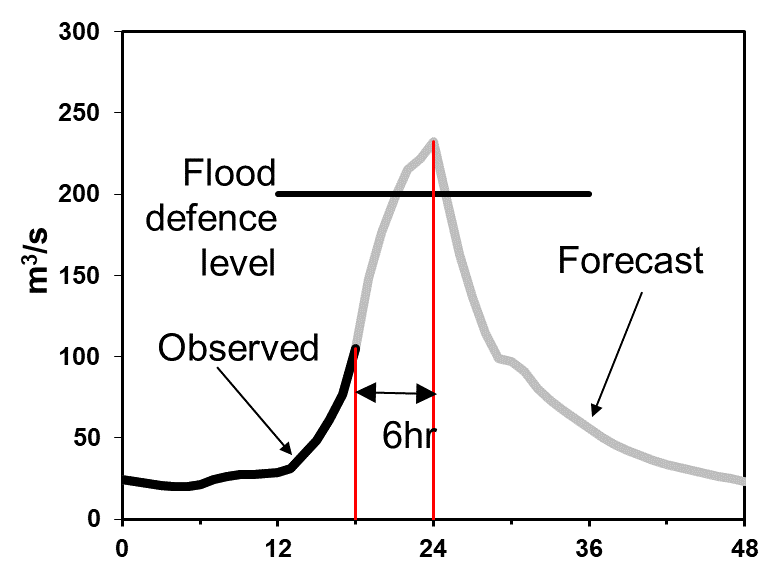
Figure 1. The deterministic forecasting system
Task 2: Probabilistic Forecasts
The probabilistic forecasts assign a probability distribution to the magnitude of the event.
Consider the simple of a channel with a dyke, Figure 2 (Todini, 2004). The expected value of the forecast is for the water level to not exceed the dyke elevation, which implies no damage, and hence no action should be taken. However, there is forecast uncertainty, which is depicted as a probability density function. The expected damage (the integral of the product of the density times the cost) is however not null, indicating a no warning decision may be inappropriate.
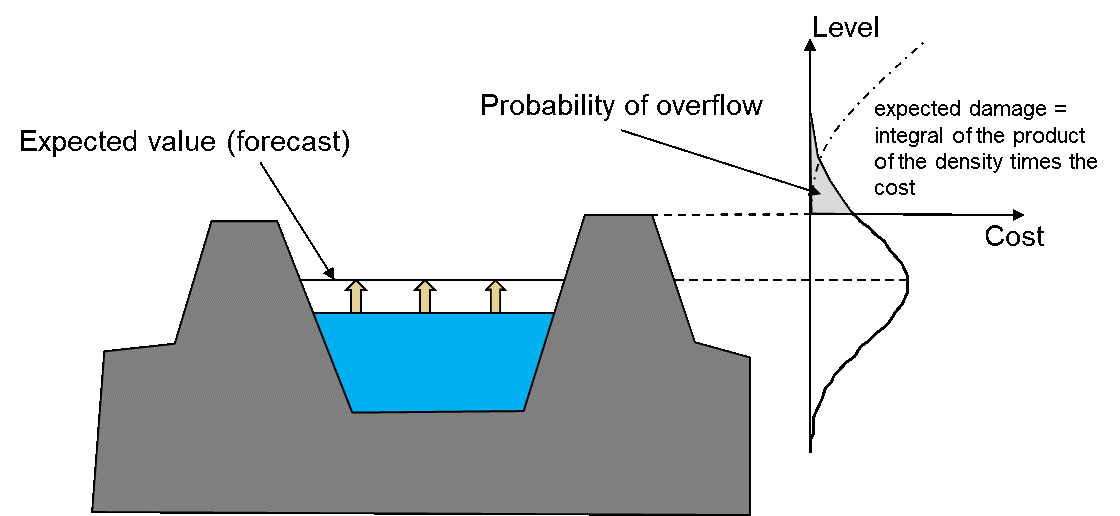
Figure 2 Issuing a warning under flood forecasting uncertainty (adapted from Todini, 2004)
For this task, you will be provided with the likelihood and reliability of the forecast. The likelihood is the exceedance probability and the reliability is the spread of the probability density function. There are 3 levels of reliability, and each forecast is associated with a unique likelihood.
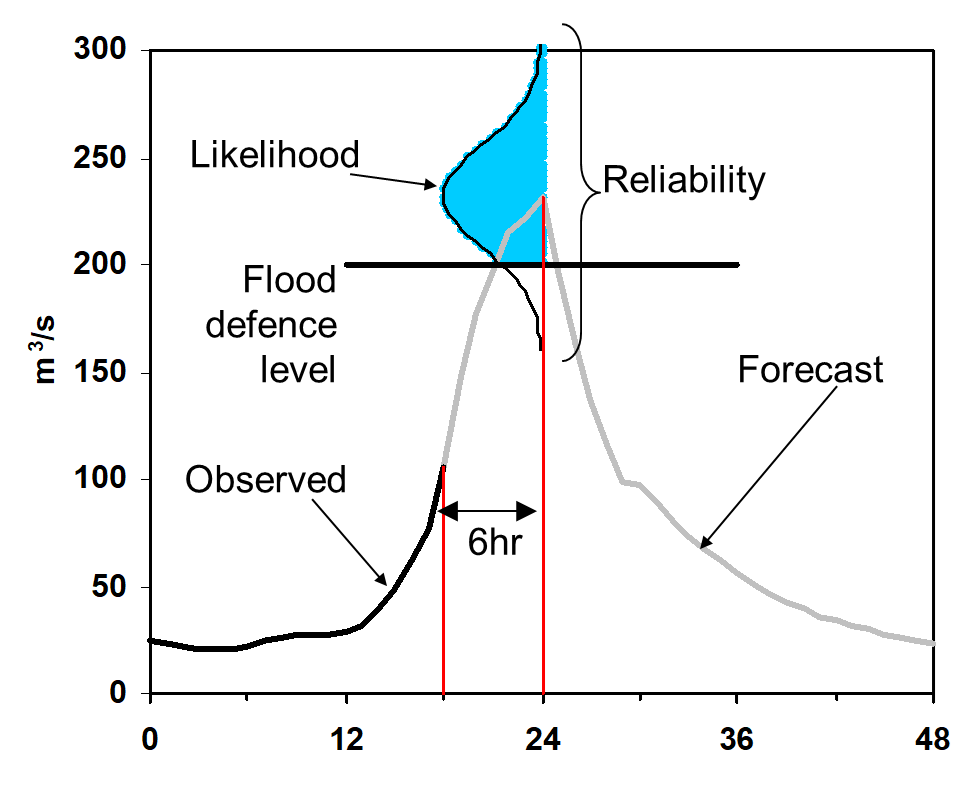
Figure 3. Forecast with uncertainty
Task 3: Evaluation of Results
Your choices have been added to a contingency table and the POD and FAR values have been calculated. Did you make better decisions when probabilistic information was available?
We have played this game with many groups of students, we conclude that probabilistic forecasts do lead to better decisions.
References
Krzysztofowicz, R., 2001. The case for probabilistic forecasting in hydrology. Journal of hydrology, 249(1-4), pp.2-9.
Ramos, M.H., Van Andel, S.J. and Pappenberger, F., 2013. Do probabilistic forecasts lead to better decisions?. Hydrology and Earth System Sciences, 17, pp.2219-2232.
Todini E. (2004) Role and treatment of uncertainty in real‐time flood forecasting. Hydrological Processes, 18, 2743–2746 DOI: 10.1002/hyp.5687