Rainfall Modelling
The 2017 China-UK Urban Flooding Symposium (pdf) identified that the accurate depiction of the spatial and temporal distribution of rainfall remains a key challenge, an issue that this work package addresses through the stochastic simulation of rainfall to better estimate extremes.
The Generalised Neyman-Scott Rectangular Pulses (GNSRP) model is one of the most advanced methods available for stochastic rainfall simulation. The model has been implemented in software at Newcastle University as RainSim, providing a state-of-the-art rainfall simulator for a variety of applications including
- Estimation of extreme events
- Storm sewer design
- Assessing regional water resources
- Climate change impact assessment
- Pluvial flood hazard assessment
The model has the capability of simulating sub-daily rainfall time series at either a single location or distributed across a catchment/region. A brief overview of the model is provided in the Model Overview subpage.
Application to Nanjing
The model has been applied to Nanjing to examine rainfall extremes, which have been used in hydraulic modelling to generate flood maps.
Observed Data
Firstly, the observed time series were obtained for the 5 locations shown in Figure 1. Hourly rainfall records were compiled for the following stations
- Nanjing (code 62724050)
- Xiaoqiao (62935200)
- Liuhe (62936600)
- Getang (62936660)
- Dongshan (63129400)
Additionally, a long daily record was available for the Nanjing station.
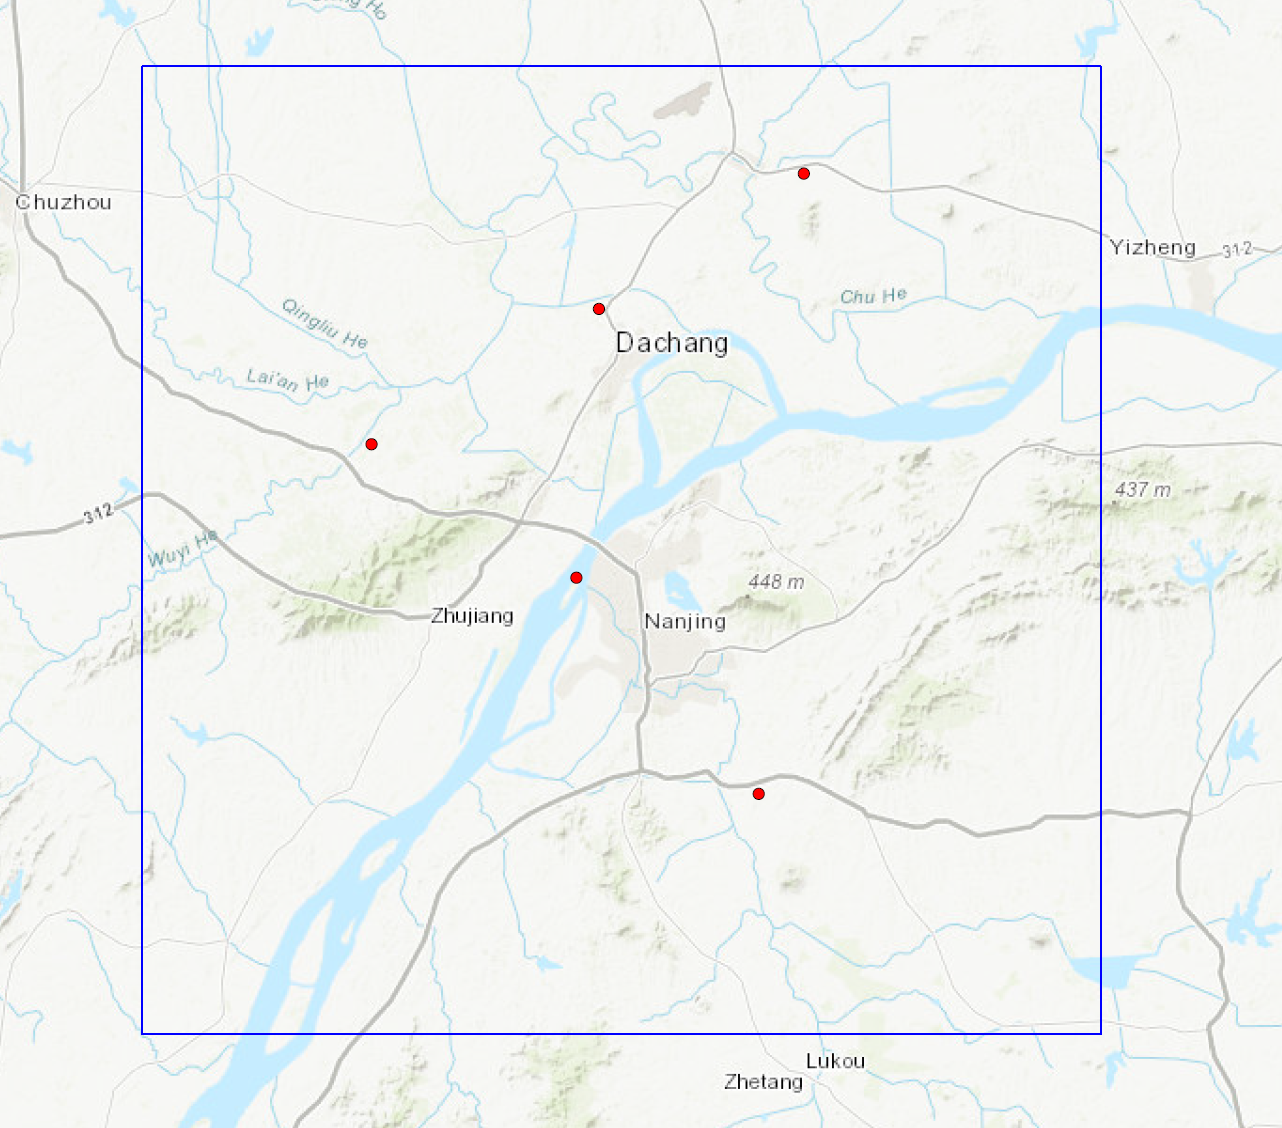
Figure 1. Modelling domain (blue box) and rain gauge locations (red dots) used in this study (map prepared in QGIS with Leaflet)
Analysis and Fitting
To apply RainSim, firstly, the statistics of relevance for hydraulic modelling were identified from the observed records ( a procedure termed 'analysis'). The statistics included were the daily and hourly mean, variance (var) probability of a dry period (pdry), the daily correlation (corr), skewness and gauge lag-1 autocorrelations, and the daily cross correlations between rain gauges. Sample daily statistics are provided in Figure 2 for the 12 months of the year. As can been seen from the top panel, the wet season is June to August, when pluvial flooding is most likely to occur.
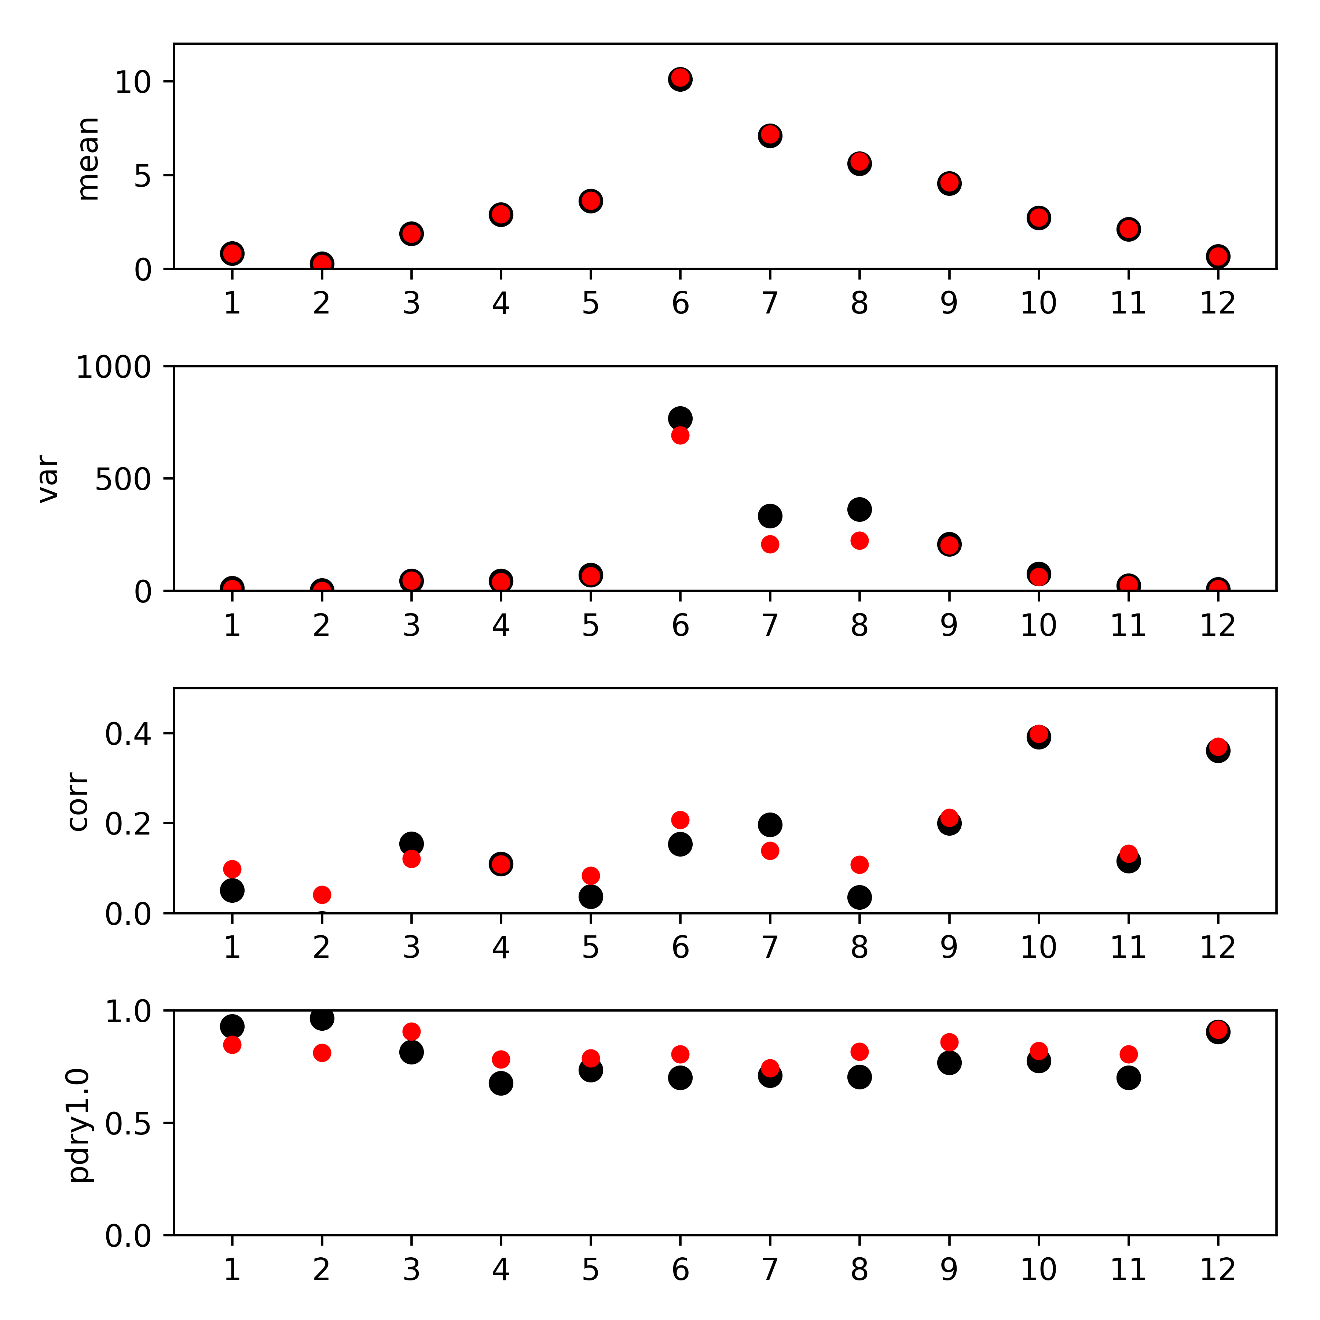
Figure 2. Sample observed (black dots) and fitted monthly statistics (red) for Nanjing (mean mm/day, var mm2, corr -, pdry -).
To fit the model, the best model parameter set that reproduces the observed statistics is identifyied. As can be seen in Figure 2, the model does reproduce the monthly observed statistics reasonably accurately.
Simulation and Evaluation
Using the identified parameter set, long synthetic rainfall fields have been generated, with an example provided in Figure 3 for a 12 hour period. The blockiness in the images is due to the fields being sampled on a 1km grid. (The rainfall fields are continuous and may be sampled at any discrete point.) In the figure, overlying circular storm cells can be observed, each of which has a given duration and intensity. The sum of the cell values at each point provides the rainfall total.
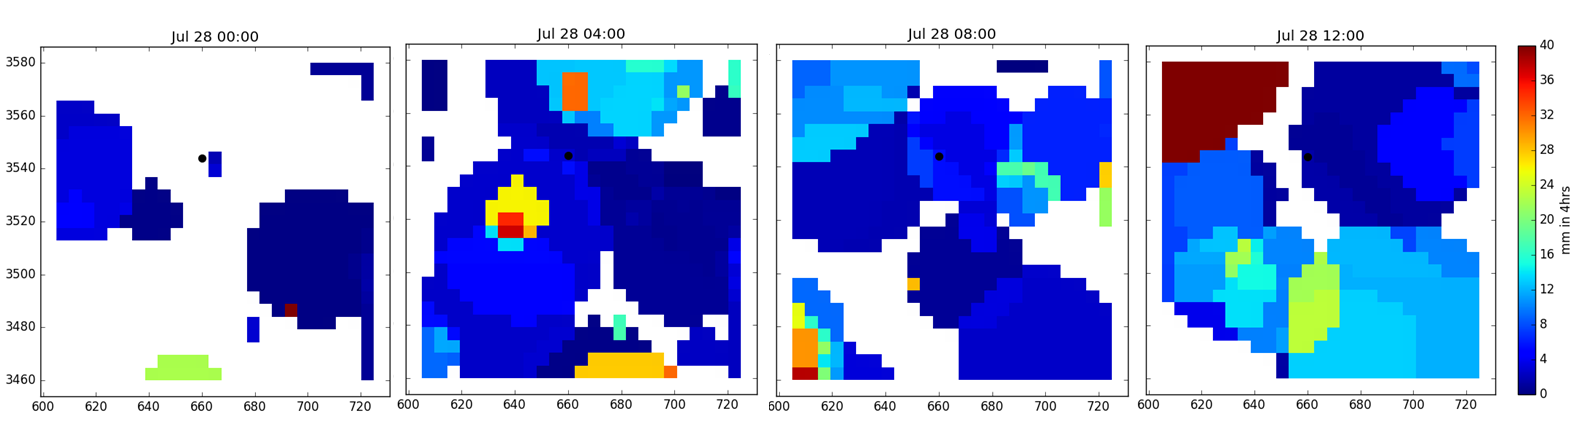 Figure 3. Sample of synthetic rainfall fields (the Nanjing rain gauge location is shown as a black dot in the upper centre of the images; for illustrative purposes, the hourly data were summed to 4hr totals)
To evaluate the model, the synthetic annual maximum totals were compared against the observed using a gumbel plot. Figure 4 shows 65 years of observed daily data (black dots), the mean of a 20 member ensemble (red dots), and the maximum and minimum of the ensemble members for each return period (red bars). The model captures the extreme events and the slope is reproduced. It is concluded that the model adequately represents the historical rainfall in Nanjing and is suitable for use in hydraulic modelling.
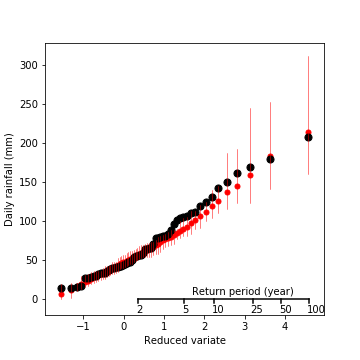
Figure 4. Gumbel plot of observed (black dots) and the mean of a 20 member ensemble (red) of daily rainfall, for Nanjing. For each return period, the maximum and minimum ensemble daily rainfall totals are shown.
RAINSIM produces hourly series. These data can be resampled to a finer resolution. Here, we use the empirical disaggregation model of Ormsbee (1989). In Figure 5, three large sample storms extracted from a 100-year rainfall series are shown. The volumes and 5-min peak intensities are similar in magnitude to those witnessed during the July 2016 event, which caused widespread inundation. These data are being used to perform a continuous simulation with the SWMM hydraulic model, which is being used in an ongoing PhD project at NHRI to assess urban drainage during extreme events at our study site.

Figure 5. Sample storms generated by RainSim at 5min interval.
Outcomes
- An implementation of the Spatial–Temporal Neyman–Scott Rectangular Pulses (STNSRP) stochastic rainfall generator, RAINSIM, has been applied to Nanjing
- The model was found to adequately reproduce the statistics of the historic hourly and daily rainfall statistics
- The model has been used to generate 'real' storms for use in hydraulic modelling and for use in probabilistic forecasting
- Rainfall data are available on our Ouputs page.
References
Ormsbee, L.E., 1989. Rainfall disaggregation model for continuous hydrologic modeling. Journal of Hydraulic Engineering, 115(4), pp.507-525.