Hydraulic Modelling
HiPIMS Hydraulic Model
The high-performance integrated modelling system (HiPIMS) has been developed for the high-resolution simulation of flood hydrodynamics in cities and catchments. The model solves the 2D shallow water equations using robust finite volume shock-capturing numerical methods and is capable of modelling different types of flood wave ranging from slow-varying inundations to extreme and violent floods (Liang et al. 2017; Xia et al. 2017; Xia et al. 2019). The model has also been implemented in modern graphics processing units (GPUs) to achieve high-performance computing and is able to support real-time flood forecasting in large domains involving hundreds of millions of computational cells (Ming et al. 2020). Through international research projects and collaborations, HiPIMS has been widely applied in UK, China, Japan and a number of South/Southeast Asian countries, including Nepal, Vietnam and Bangladesh.
Application of 2D hydraulic models for real‐time surface water flooding is not usually applied within operational systems due to high computational demands. Using modern high-performance computing technology, HiPIMS demonstrates the promise of achieving real-time flood modelling at the city scale (Ming et al, 2020).
The July 7th event for our study site and several design storms have been simulated to demonstrate this potential.
Model Specification for the Case Study Site
The application of the HiPIMS model requires the following data sets:
- A high-resolution Digital Elevation Model (DEM): A 12.5 m DEM was obtained from Advanced Land Observing Satellite (ALOS), which was interpolated to a 2.5m resolution for use in this study. There are 30 million pixels within the domain, 30.38km2.
- Buildings are reinserted onto bare earth terrain data to develop the final DEM. The building height is set as the product of the building layers and each layer height. The inner rivers are also burned in the earth terrain data using in a similar way. The rivers are assumed to be -5 m lower than the surface in the developed DEM, based on field surveys.
- Roughness coefficient: Each pixel was assigned a Manning coefficient of 0.035, the value was selected on the basis of previous modelling experience.
- Rainfall data: Local hourly rainfall data were obtained and a number of storms for given return periods were generated using the RAINSIM stochastic model.
To represent the storm sewer drainage losses, an infiltration loss is assigned to the roads. A value of 13.2 mm/hr was specified, with the losses from the roads placed in the adjacent inner rivers. This is approach is commonly used in hydraulic modelling, but Qian et al. (2020) extend HiPIMS using a novel numerical scheme to calculate flow dynamics in pipes, which could be utilised as future work.
Results
July 2016 Storm
Figure 1 shows the hourly rainfall for the July 7th 2016 event, approximately 140mm of rainfall was recorded in a 7-hour period (Wang et al. 2019). It should be noted that the estimation of the event total is difficult due to the highly localised nature of the storm.
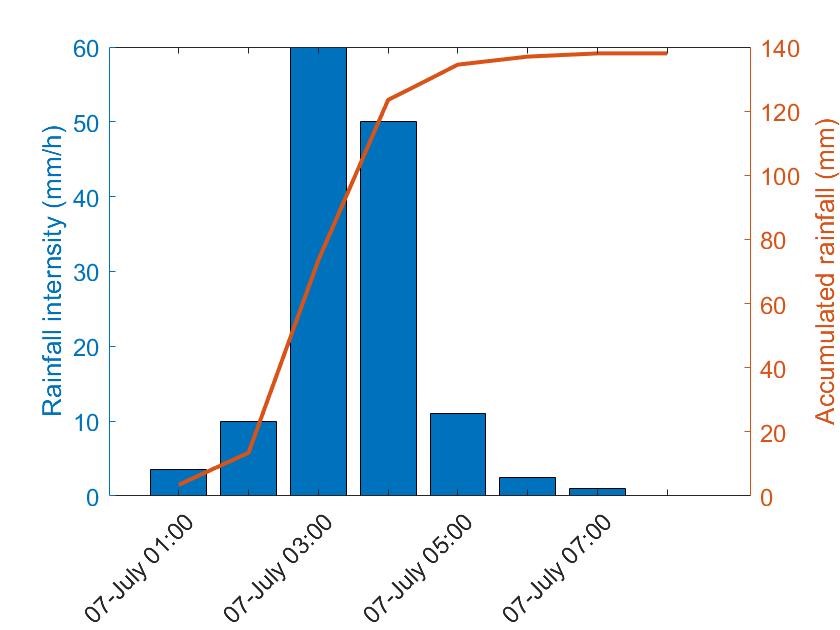
Figure 1. Rainfall recorded at the Dongshan gauge, Nanjing, July 7th 2016
The maximum recorded inundation depths for the July 2016 storm event are shown in Figure 2. The inner rivers are visible as dark red lines and pockets of flooding are shown in other colours.
Comparisons have been made at selected points against media reports of flooding. The simulation results are generally consistent with the reports. The results should be interpreted with care due to the error and uncertainty of the adopted DEM and data from the media reports. However, the depths are available in the Outputs section of this website.
The model run time for this 7hr event was 6.5 hrs, which approaches the potential required for real-time forecasting.
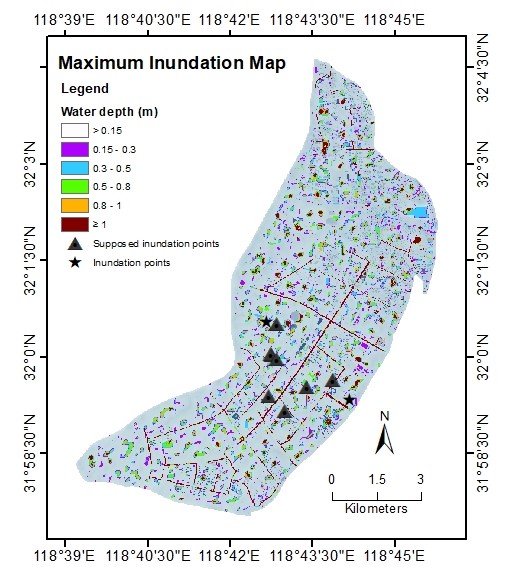
Figure 2. Maximum simulated flood depths, July 7th 2016
In Figure 3 an animation of the flood depths is shown that depicts the evolution of the flood event.
Figure 3. Animation of flood depths at 30minute intervals, July 7th event
Design Storms
Here, we consider uncertainty in rainfall forecasting by performing several simulations with different return period rainfall events and compare the simulated maximum flood extent. The return periods are provided in Table 1. The return periods were derived based on an analysis of the summer events.
|
Return period (years) |
Storm Rainfall (mm) |
|
25 |
162 |
|
50 |
185 |
|
100 |
208 |
Table 1. Rainfall total associated with given return periods
For each return period, 2 storms were selected from a 1000-year RAINSIM simulation (Figure 4)
- a relatively long (~8hrs) lower intensity event (blue)
- a shorter duration (~4hrs) high-intensity event (orange)
Thus, we sample potential uncertainty in the duration and shape of rainfall forecasts.
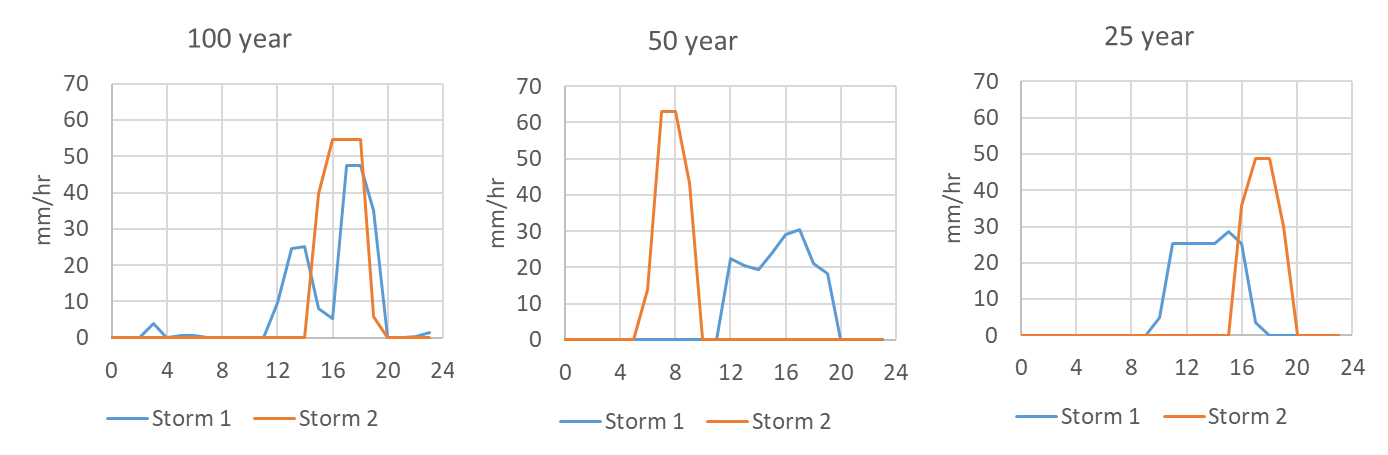
Figure 4. Synthetic storms associated with different return periods.
The highest water depth was found for each pixel in the modelling domain. A depth of 0.15m does not have serious implications for traffic or pedestrians. Also, 0.15m broadly corresponds to curb height, above which damage to property may be expected. The percentage of the area of Shazou polder inundated is shown for the set of storms in Figure 5, with depths <0.15m excluded from the analysis.
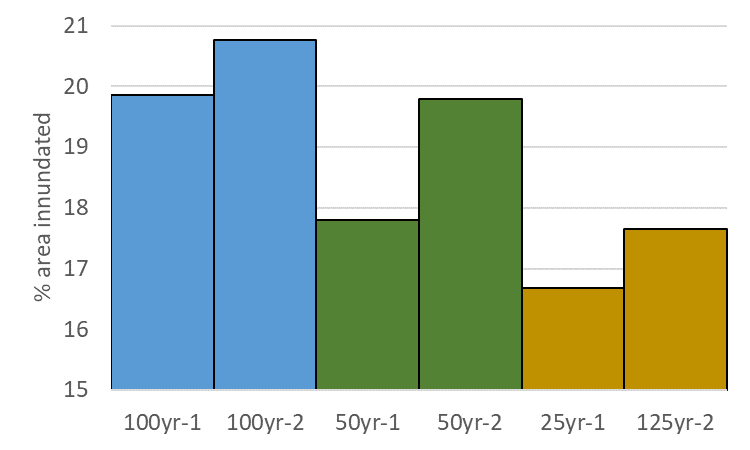
Figure 5. Inundated area, expressed as a percentage of the study site area, for 2 storms selected for three return periods. The labels refer to the rainfall return period and the storm number.
As expected, the inundated area increases with the rainfall event return period (i.e. Figure 5 right to left). Additionally, for a given return period, the inundated area is greater for the high-intensity storm (i.e. storm 2). Note, a high-intensity storm can give a similar inundated are to that for a lower intensity storm of a higher return period (e.g. compare 25yr-2 with 50yr-1), indicating both storm profile and duration are of importance. However, we do note that the inundated extent only varies between ~16.5 and 21%. This is because water tends to pool in low areas within the polder.
Sources of Uncertainty and Recommendations
The three most commonly considered sources of uncertainty in urban modelling are:
- Topographic data: Surface elevations are a dominant influence on the location of inundated area. Here, the best available data set has been used.
- Roughness coefficients: Due to lack of the land-use / land-cover data, the spatially uniform Manning coefficient value of 0.035 is used by default.
- Rainfall rates: Due to errors in gauge or radar measurements.
We do recognise that the DEM resolution should be improved to allow the micro-features that influence flow to be represented, for example through the collection of LiDAR data. Liang and Smith (2015), for a city in southern England, demonstrate how a 2m DEM was required to capture the network of canals and lakes, which reduced the flood extent in comparison to using coarser representations. This is a similar situation to Nanjing, given the presence of the inner rivers. The modelling of the potential sponge city measures will require high-resolution DEMs. Additionally, the study of Liang and Smith (2015) demonstrated the benefits of modern graphics processing units to accelerate large-scale high-resolution simulations.
Coarser grid resolutions typically exhibit a lower sensitivity to Manning's n (Liang and Smith, 2015). However, low sensitivity is not a justification for using coarse resolutions as the difference in the inundation extent in comparison to fine resolution grids greatly exceeds the influence any parameterisation might have.
The rainfall data were obtained from the Dongshan gauge. However, the storm was highly localised and a single point measurement is not sufficient to capture the spatial-temporal rainfall patterns. Capturing extreme rainfall remains a key challenge in urban flood modelling. The use of radar for the post-analysis of events and real-time flood forecasting offers one avenue that should be explored, but we acknowledge that this technology still has limitations. We verify our results using newspaper reports; the use of social media does offer an additional opportunity to verify modelling results (Smith et al, 2017).
Finally, it should be noted that inundation mapping for storms of a given duration may require frequent updating, given the rapid urban expansion encountered in many Chinese cities.
Future Work
Beyond the scope of this project, the following items are suggested for future work
- Incorporation of the sewer network, following the scheme of Qian et al. (2020)
- Develop and incorporate modelling components for relevant hydraulic structures and flood protection infrastructures e.g. pumping stations, flood gates.
- Improve the quality of data to support more reliable flood simulations, including DEM, land-use/land-cover data, drainage information and observation data.
Outcomes
- A near real-time hydrodynamic flood forecasting model has been developed for Shazhou polder (Hexi New Town)
- Detailed flood inundation maps have been generated for storms with given return periods.
- Data products are provided in our Outputs page.
References
Li, Q., Liang, Q. and Xia, X., 2020. A novel 1D-2D coupled model for hydrodynamic simulation of flows in drainage networks. Advances in Water Resources, 137, p.103519.
Liang, Q., Smith, LS., 2015. A high-performance integrated hydrodynamic modelling system for urban flood simulations. Journal of Hydroinformatics, 17(4): 518-533.
Liang, Q., Smith, L. & Xia, X. New prospects for computational hydraulics by leveraging high-performance heterogeneous computing techniques. J Hydrodyn 28, 977–985 (2016). https://doi.org/10.1016/S1001-6058(16)60699-6
Lyu, H.-M.; Xu, Y.-S.; Cheng, W.-C.; Arulrajah, A. Flooding Hazards across Southern China and Prospective Sustainability Measures. Sustainability 2018, 10, 1682.
Ming, X., Liang, Q., Xia, X., Li, D., Fowler, HJ., 2020. Real-time flood forecasting based on a high-performance 2D hydrodynamic model and numerical weather predictions. Water Resources Research, 56, e2019WR025583.
Smith, L., Liang, Q., James, P. and Lin, W. (2017), Assessing the utility of social media for flood risk management. J. Flood Risk Manage, 10: 370-380
Wang, B., Loo, B.P., Zhen, F. and Xi, G., 2020. Urban resilience from the lens of social media data: Responses to urban flooding in Nanjing, China. Cities, 106, p.102884.
Xia, X., Liang, Q., Ming, X., 2019. A full-scale fluvial flood modelling framework based on a High-Performance Integrated hydrodynamic Modelling System (HiPIMS). Advances in Water Resources, 132, 103392
Xia, X., Liang, Q., Ming, X., Hou, J., 2017. An efficient and stable hydrodynamic model with novel source term discretization schemes for overland flow and flood simulations. Water Resources Research, 53, 3730-3759
Xing, Y., Liang, Q., Wang, G. et al. City-scale hydrodynamic modelling of urban flash floods: the issues of scale and resolution. Nat Hazards 96, 473–496 (2019).