Case Study
Evaluating Deterministic and Probabilistic Forecasts
Here we pull together all the strands of our work to demonstrate the usefulness of using predictive uncertainty in real-time flood forecasting.
In summary, we
- Develop a conceptual rainfall-runoff model of our urban study site, that runs in continuous simulation
- Generate ‘real’ storms and their forecasts through Monte Carlo sampling
- Develop a rainfall threshold curve, that informs a Flood Manager when a Risk Reduction Action (a pumping strategy) may be necessary based on a rainfall forecast
- Analyse proactive strategies to reduce flooding, by drawing down the inner river levels prior to the storm arrival based on threshold curve and the forecast
- Compare the performance of the deterministic and probabilistic forecasts, in terms of inundation and pumping costs incurred
- Finally, we conclude that incorporating predictive uncertainty leads to better decision-making
Full details of the approach are provided in: L. Duque (submitted). A Monte Carlo Simulation Study of the Factors Influencing the Performance of Flood Early Warning Systems. PhD thesis, Newcastle University, UK.
Coupled Human and Hydrologic System
The modelling framework for our study site, Shazhou polder, is developed within a Coupled Human and Hydrologic System framework, Figure 1.
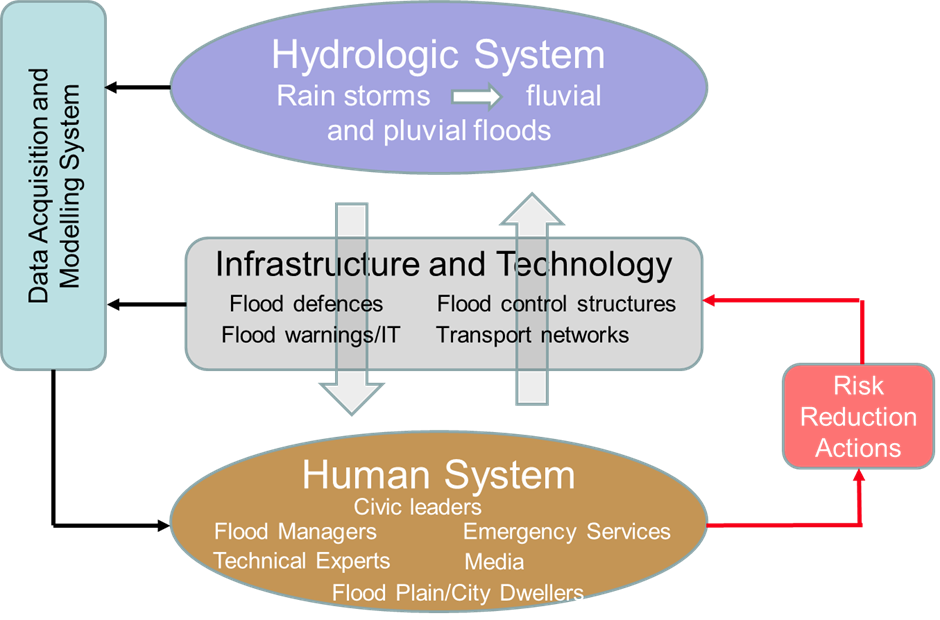
Figure 1. A Coupled Human and Hydrologic System
Conceptual Model of Study Site
We simplify the representation of the study site in the form of a conceptual model (Figure 2) that incorporates the important properties and processes, essentially the Hydrologic System and the Infrastructure and Technology components in Figure 1. The polder contains a number of manmade inner rivers and is surrounded by natural outer rivers. These are represented as buckets. During a flood event, runoff from the urban area enters the inner river bucket via a pipe, which is a conceptual representation of the storm sewer network. The level of the inner rivers is controlled by pumping water to the outer river. However, if the water level in the inner rivers rises above the level of the pipe, waterlogging in the urban area occurs. It is therefore essential that an appropriate pumping strategy is implemented to control the water levels. The model is run in continuous simulation, at a 1-hour time step and driven by a long time series of simulated rainfall inputs derived through Monte Carlo sampling.
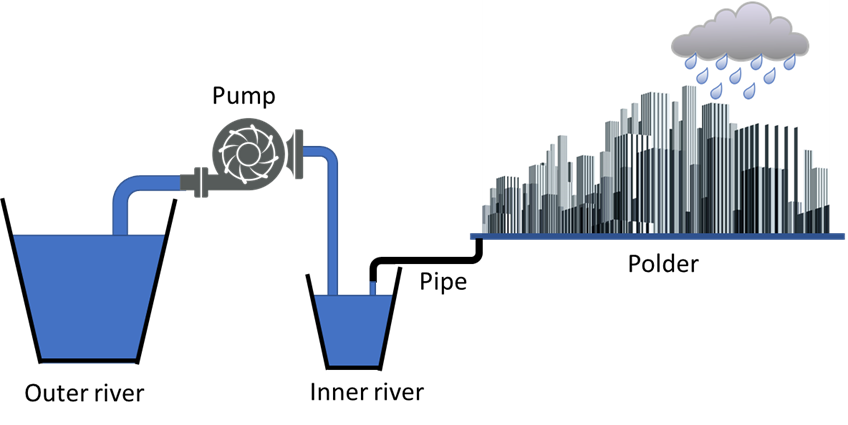
Figure 2. Conceptual model of the Shazhou polder
Rainstorms Component
‘Real’ storms and their forecasts have been generated for the study using the RAINSIM stochastic rainfall model, which reproduces the daily and hourly statistics of local observed rainfall, Figure 3.
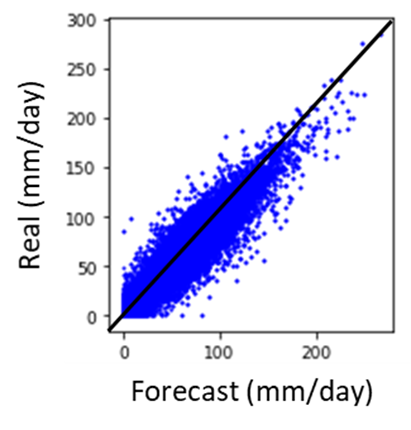
Figure 3. ‘Real’ storms and their ‘forecasts’ generated using the RAINSIM. Stochastic model
The observed statistics and the corresponding values simulated by RAINSIM are provided in Table 1, for July. RAINSIM adequately reproduces the observed statistics.
Table 1. Observed statistics and their corresponded values reproduced by the RAINSIM model for July
|
Statistic |
Observed |
RAINSIM |
|
The mean daily rainfall accumulation |
6.5 |
6.4 |
|
The probability that a day has no rainfall |
0.7 |
0.8 |
|
The variance of the daily rainfall accumulations |
335 |
335 |
|
The daily lag-1 correlation of the daily accumulations |
0.2 |
0.3 |
|
The skewness coefficient of the daily accumulations |
4.9 |
3.9 |
|
The probability that a one-hour accumulation is dry |
0.9 |
0.9 |
|
The variance of the one-hour accumulations |
2.8 |
2.8 |
|
The skewness coefficient of the one-hour accumulation s |
11.4 |
11.3 |
Runoff Generation Component
For a given storm, the time-series of runoff from the polder to the inner rivers is calculated using a simple model, derived from the analysis of the outputs of a hydraulic model. This approach was taken as, even given advances in model computational performance, it is still not possible to run 2D hydraulic models continuously over many years.
Waterlogging
The relationship between the depth of the inner rivers and the area of the polder inundated is shown in Figure 4, which was derived ina previous study (Gao et al., 2012). Inundation begins when the water levels reach the height of the pipe outlet (Figure 1).
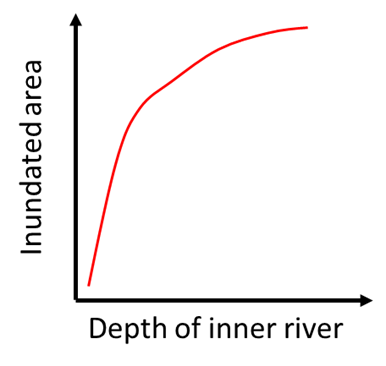
Figure 4. Schematic of inundated area – inner river depth relationship
The Human System
The main actors that we represent within our framework are Flood Managers who control the pumping strategy of the inner rivers (the Risk Response Action). Their role is to minimize waterlogging, but consideration is also needed of the monetary cost of pumping. These actions are informed by a Flood Warning System, that employs a rainfall threshold curve.
Rainfall Forecasting and Warning Threshold Approach
The Flood Manager is provided with a daily rainfall forecast. Based on this information, and knowledge of the current inner river water level, a decision has to be made as to whether a Warning will be issued. If a Warning is issued pumping will be performed to try to prevent flooding/waterlogging from occurring.
Using our conceptual model, we developed a daily rainfall threshold curve, that provides the depth of daily rainfall that will cause waterlogging for a given initial inner water level (h0), Figure 5a. If the rainfall depth exceeds the curve then flooding will occur. Taking a deterministic approach, a decision to warn, and take action, would be taken based on the rainfall forecast in relation to this curve. However, we know forecasts are inherently uncertain (e.g. see the scatter in Figure 3).
To include the predictive uncertainty in the forecasts, we analyse the relationship between the ‘real’ (Rdaily) and forecasts (Řdaily ) of daily rainfall values (Figure 2). A bivariate gamma distribution was used to build the description of the predictive uncertainty. Thus, for a given forecast we can derive the probability of exceedance and use this information with our threshold curve, Figure 5b. If the exceedance probability exceeds a specified probabilistic threshold, a warning is given.
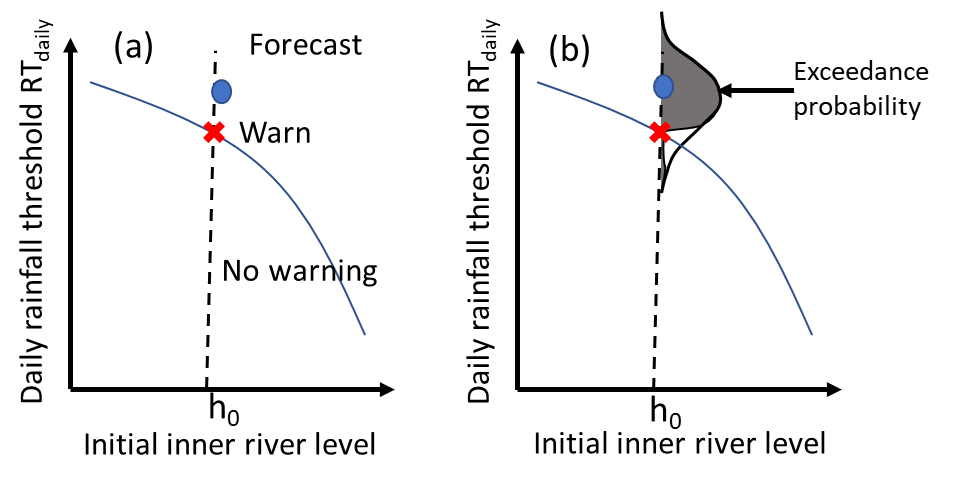
Figure 5. (a) Deterministic and (b) probabilistic daily forecast threshold curves
Scenarios
To evaluate the performance of the system under different strategies, we analyse three scenarios (Figure 6):
- No forecast scenario: this represents a baseline case where pumping is performed reactively as the water levels rise with the onset of rainfall (i.e. we do not use the daily rainfall forecast threshold curve). No proactive pumping is performed.
- The deterministic forecast scenario: this uses the forecasts deterministically, with proactive pumping performed prior to the event arrival based on whether the forecast exceeds the daily threshold curve (Figure 5a).
- The probabilistic forecast scenario: as for case (2), but the decision to proactively pump is based on whether the exceedance probability exceeds a specified probabilistic threshold (Figure 5b)
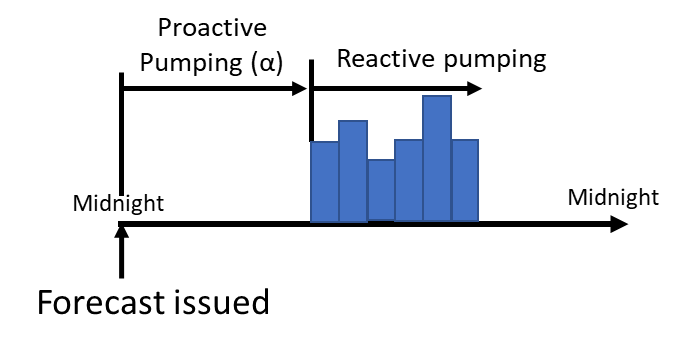
Figure 6. Proactive and Reactive flood management strategies
Note, we only have daily rainfall forecasts, but we use our conceptual model to simulate the polder system using the ‘real’ storm on an hourly timestep. If a large burst of rainfall occurs during the storm, the pumping capacity will be exceeded. Hence a reactive pumping strategy will fail. The aim of the proactive pumping in the forecast scenarios (cases 2 and 3) is therefore to provide a surplus of storage prior to the event arrival to deal with such situations.
The Flood Manager has a forecast of rainfall, and hence they have a prediction of how far above the threshold curve shown they may be (Figure 5, blue circle). It is not necessary to pump a volume of water corresponding to the rainfall depth above the curve, as reactive pumping will occur during the event. Rather, the Flood Manager will pump a fixed proportion of the rainfall volume exceeding the curve, α, providing a surplus of storage that is available during the event if the required pumping capacity is exceeded. The parameter α reflects how risk-prone or risk-averse the manager may be; a risk-averse Manager may select a high value of α (0.2) and, alternatively, a more risk-prone Manager may choose a low value (0.05).
Outcomes
To evaluate the performance of the system we use two metrics, the maximum inundated extent (using Figure 4) and the costs associated with pumping. These values are calculated from a continuous simulation.
Deterministic Scenario
In Figure 7, the trade-off between inundated area and pumping costs is provided for the deterministic case, with the red dot representing the baseline no forecast scenario. Each blue triangle is associated with a value of alpha, increasing from low values (risk-prone) to high values (risk-averse) from left to right.
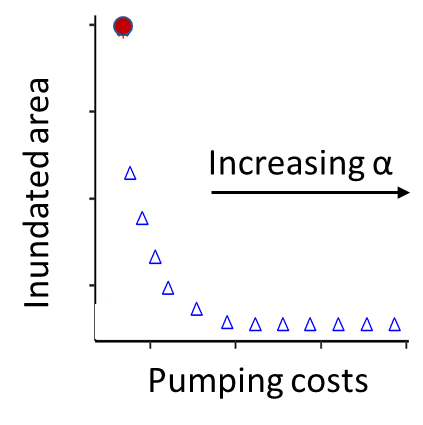
Figure 7. Trade-off between pumping costs and inundated extent, deterministic forecasts
It can be concluded from Figure 7 that forecasts do have value; the inundated area can be significantly reduced if proactive pumping is performed prior to the event based on the critical threshold curve. However, if the Flood Manager is too risk-averse (large α) high pumping costs will occur with little reduction in the inundated extent.
Probabilistic Scenario
In the probabilistic scenario we must specify a probabilistic threshold. If the exceedance probability is higher than this threshold (Figure 5b) a warning is issued, and proactive pumping takes place. The proactive strategy uses the same values of α as in the deterministic case.
For each value of α (0.05-0.2) used in the probabilistic proactive strategy, we have a set of points associated with a set of probabilistic thresholds (0.1-0.9). For a value of α= 0.05, the best predictive threshold is 0.9, while for α=0.2 the threshold is 0.7. The best points are shown as black circles in the Figure. 8 (i.e. form a Pareto front).
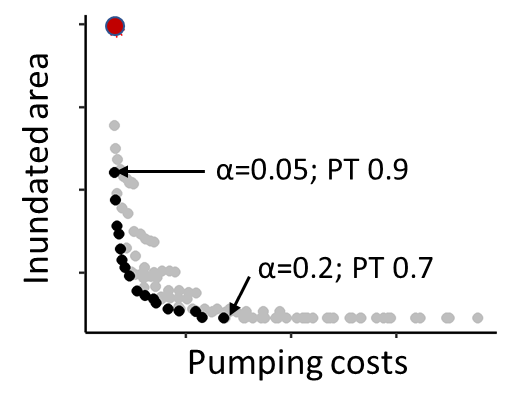
Figure 8. Trade-off between pumping costs and inundated extent, probabilistic forecasts, PT = probability threshold
Comparison of Deterministic and Probabilistic Forecasts
We combine the results in Figure 7 with the best values attained from Figure 8 (i.e. the black circles) to address the question: Does the use of predictive uncertainty improve decision-making? As can be seen in Figure 9, for any given deterministic forecast, we can find a probabilistic forecast that has a lower cost and lower inundated area. We conclude, the use of probabilistic information does improve decision-making.
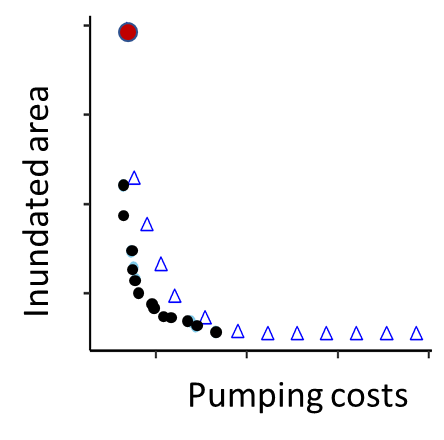
Figure 9. Trade-off between pumping costs and inundated extent, for the deterministic (blue triangles) and probabilistic (black circles) scenarios.
The black circles in Figure 9 could form the basis of a look-up table. A Flood Manager could have a preference for the trade-off between costs and inundation. By selecting a point on the Figure, the associated α and predictive threshold can be used in the flood forecasting system to reflect their preference.
References and Additional Information
Cheng, G., Jun, L., Han, C. and Jie, Z., 2009, June. An effective way to determine maximum capacity of pump stations for urbanized polders. In 2009 3rd International Conference on Bioinformatics and Biomedical Engineering (pp. 1-3). IEEE.
Gao C, Liu J, Cui H, Hu J. 2013. Treatment of pump drainage boundary in riverside city. Environmental Earth Sciences 68 (5): 1435–1442
Gao, Y., Yuan, Y., Wang, H., Schmidt, A.R., Wang, K. and Ye, L., 2017. Examining the effects of urban agglomeration polders on flood events in Qinhuai River basin, China with HEC-HMS model. Water science and technology, 75(9), pp.2130-2138.
Liu, C., Guo, L., Ye, L., Zhang, S., Zhao, Y. and Song, T., 2018. A review of advances in China’s flash flood early-warning system. Natural hazards, 92(2), pp.619-634.
Martina, M.L.V., Todini, E. and Libralon, A., 2006. A Bayesian decision approach to rainfall thresholds based flood warning. HESS 10 (3), pp.413-426.