Contingency Table
In the triggering of alarms there are 4 possible outcomes, Figure 1:
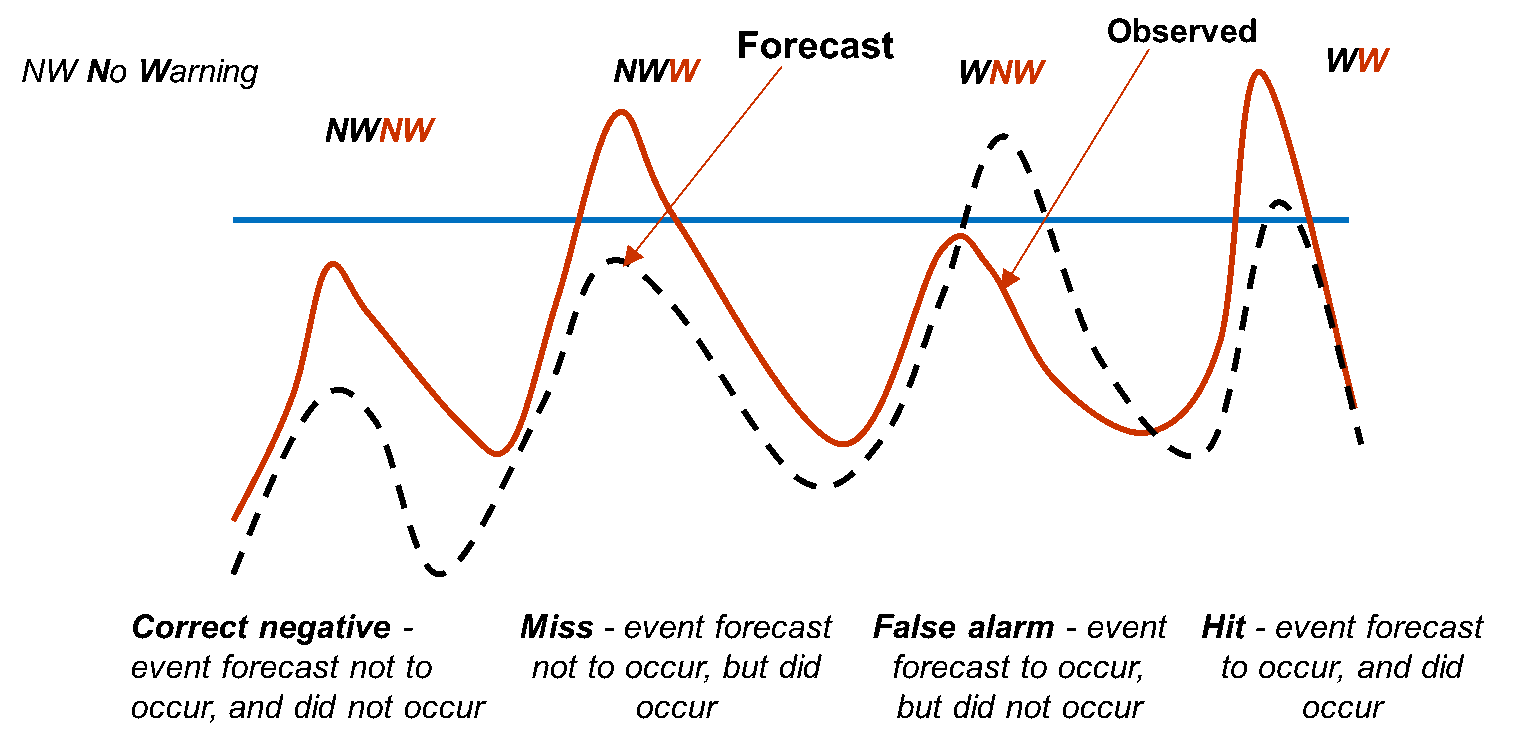 Figure 1. Possible outcomes for a flood forecast
A contingency table is a useful way to see what types of errors are being made, Table 1. A perfect forecast system would produce only hits and correct negatives, and no misses or false alarms.
|
Observed |
|||
|
NW |
W |
||
|
Forecast |
NW |
Correct Negatives |
Misses |
|
W |
False alarms |
Hits |
|
Table 1. Contingency Table (NW no warning; W warning)
Different skill scores can be calculated from a contingency table, the most common are the probability of detection (POD) and the false alarm ratio (FAR).
POD addresses the question: What fraction of the observed "yes" events were correctly forecasted?
POD = hits / (hits + misses)
where a perfect score is 1. POD can be artificially improved by issuing more "yes" forecasts to increase the number of hits, hence it is typically used with FAR.
FAR addresses the question: What fraction of the predicted "yes" events actually did not occur?
FAR = false alarms / (false alarms + hits)
where a perfect score is zero. FAR can be artificially improved by issuing more “no” forecasts to decrease the number of false alarms.
References
David Stephenson provides a comprehensive Glossary of terms used in forecast verification (free access).