SWMM Model
The Storm Water Management Model (SWMM) is used internationally for the planning, analysis, and design of drainage systems. For example, the model has been widely used in China to aid in the Sponge City initiative, which aims to make cities act like sponges, absorbing water during wet periods and releasing it during dry periods (Randall, 2019).
SWMM is being used in an ongoing piece of research that is being conducted by a student at NHRI as part of their PhD studies. The aim is to set-up a model of Nanjing, explore the impacts of the uncertainty in the parameterization on decision making, and examine measures to reduced flood impacts. We report findings to date.
Overview of the SWMM model
The SWMM model includes four compartments, Figure 1:
- atmosphere compartment (precipitation, deposit pollutants),
- land surface compartment (evaporation, infiltration, runoff),
- sub-surface compartment (transfer inflow as groundwater interflow),
- conveyance compartment (channels, pipes, pumps, and regulators)

Figure 1. SWMM model compartments and main processes
Model Setup and Preliminary Simulations
Combining topographic information, infrastructure and hydrological properties, a model has been set-up for our study site, Figure 2. This includes a detailed representation of the roads, drainage network, and the inner rivers.
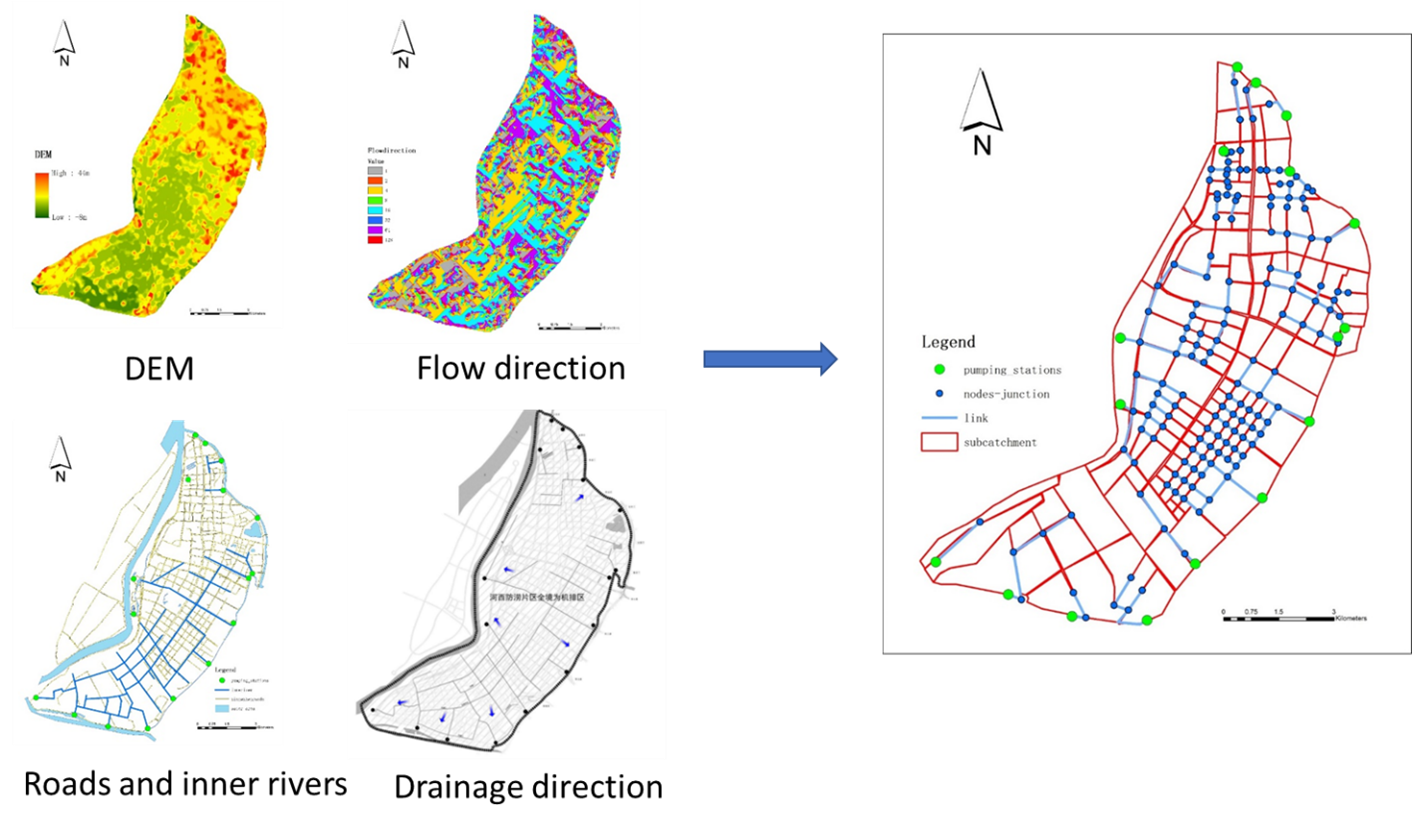 Figure 2. SWMM model of the Shazhou polder
The parameters associated with the greatest uncertainty are:
- Pipes: The pipe Manning roughness coefficient (baseline value: 0.01) and the pipe diameter (1 meter)
- Surface runoff: The Manning coefficient of the impervious area (0.013) and the pervious area (0.15), areas, and the impoundage of pervious area (12mm) and impervious area (2mm)
- Horton infiltration model: the maximum infiltration efficiency (80mm/h), the minimum infiltration efficiency (1mm/h), the attenuation constant for routing (4), and the drainage time (7 days)
Results from the baseline simulation are provided in Figure 3. In the left panel, the infrastructure and reports of past flooding (blue dots) are provided. The right panel shows flooded areas (purple dots). There is a reasonable correspondence between observed and simulated flooding locations. (Note, the flood reports are taken from the media, and may not be comprehensive.) This provides a strong basis for future model development.
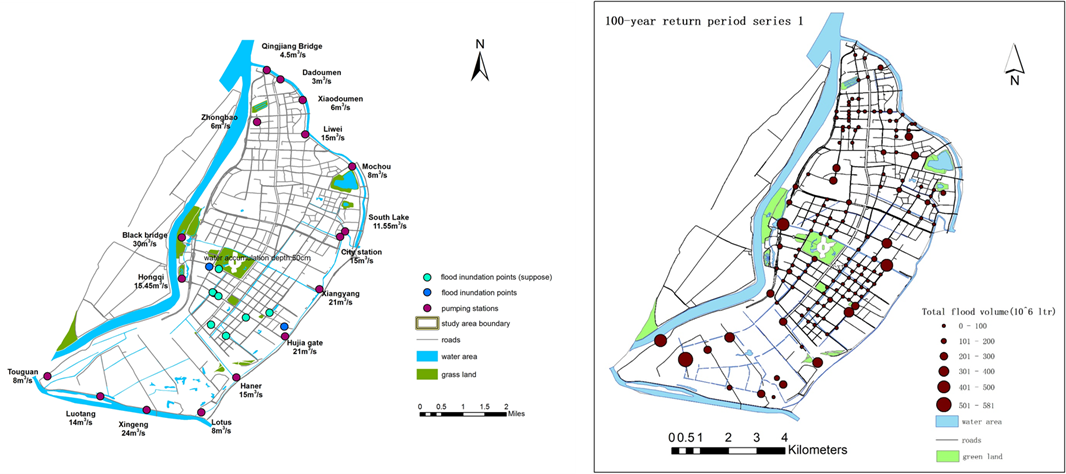
Figure 3. Study site showing infrastructure and locations reporting flooding during the Huly 2016 event (left panel) and SWMM simulation of a 100 year rainfall event (right panel)
Comparison of SWMM and HiPIMS
SWMM and HiPIMS both have a successful history in their application to urban flooding problems. The choice of model depends on the intended application. SWMM is a rainfall-runoff model, with contaminant transport, which represents the full hydrological cycle in a semi-lumped discretisation (Niazi et al., 2017). HiPIMS is an event-based model, that discretises a catchment on a fine grid-scale, producing depth-averaged velocities. However, the description of the hydrological cycle is less complete. SWMM has a set of low-impact development components, that allow the effectiveness of interventions such as porous pavements, green roofs, swales, and rain barrels, to be assessed. HiPIMS is a near real-time flood model that has a highly sophisticated representation of flow processes and can resolve flooding at the building scale.
|
|
SWMM |
HiPIMS |
|
Time |
Continuous |
Event based |
|
Spatial |
Semi-lumped |
Grid-based (with velocities and depths calculated at the pixel scale; explicit representation of buildings) |
|
Hydraulics |
Kinematic or dynamic wave |
2D shallow water equations (with accurate representation of complex flows) |
|
Pipes |
Open and closed systems |
Open and closed systems |
|
Hydrology |
Full hydrological cycle |
Antecedent conditions must be specified; infiltration in green areas included |
|
Groundwater |
Represented |
NA |
|
Pollutants |
Included |
NA |
References
Deng, S., Zhang, X., Shao, Z., Yan, W., Chai, H. and He, Q., 2019. An integrated urban stormwater model system supporting the whole life cycle of sponge city construction programs in China. Journal of Water and Climate Change, 10(2), pp.298-312.
Niazi, M., Nietch, C., Maghrebi, M., Jackson, N., Bennett, B.R., Tryby, M. and Massoudieh, A., 2017. Storm water management model: performance review and gap analysis. Journal of Sustainable Water in the Built Environment, 3(2), p.04017002.
Randall, M., Sun, F., Zhang, Y. and Jensen, M.B., 2019. Evaluating Sponge City volume capture ratio at the catchment scale using SWMM. Journal of environmental management, 246, pp.745-757.