![]()
|
|
|
|
Case Study 6 - 45 Years of Changes in Forest Hydrology at the Experimental Coalburn Catchment
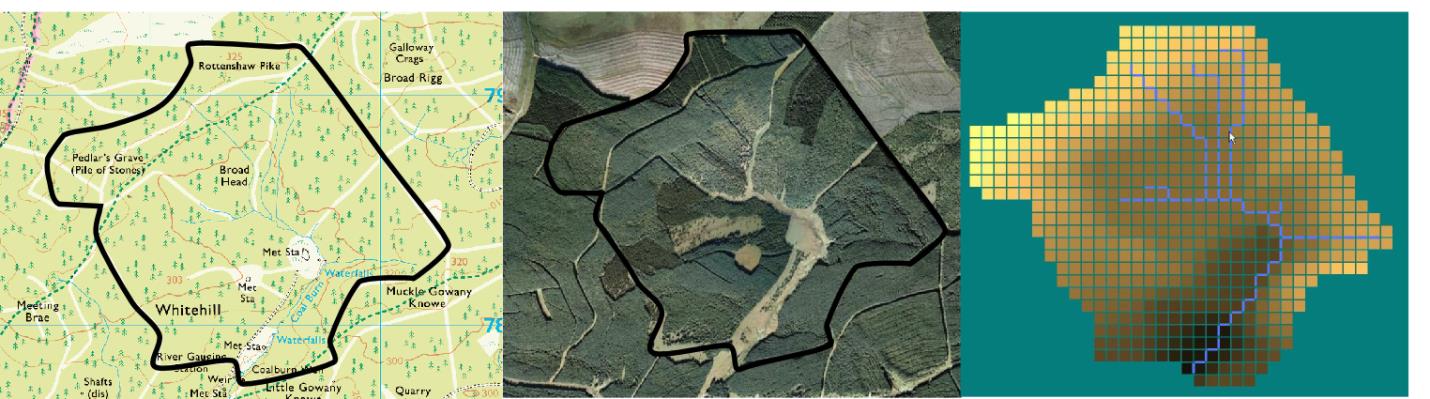
BackgroundCoalburn is the longest running forest research catchment in the UK and it provides a unique dataset for looking at the long-term affects of forestry on hydrology. Research at the site started in 1967 when the 1.5 km2 catchment was instrumented and the boundary defined. In 1972/73 the site was ploughed and planted. Since then the trees have grown and they have now reached maturity. Shetran hydrological modelling has been carried out for most recent 19 years of detailed data.
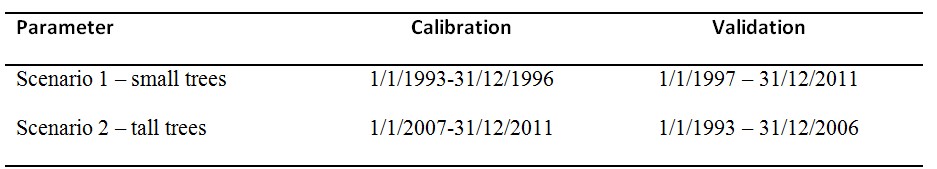
Shetran SimulationThe Coalburn catchment is somewhat unusual in that the growth of trees in the catchment has a considerable effect on the hydrology of the catchment and so the discharge is not stationary. The approach here is to carry out two split sample calibration/validations. The first calibration/validation uses the period from 1/1/1993-31/12/1996 for calibration and 1/1/1997 – 31/12/2011 for validation and the second calibration/validation uses the period from 1/1/2007 -31/12/2011 for calibration and 1/1/1993-31/12/2006 for validation. To account for the non stationary catchment the only parameters changed were the aerodynamic resistance and canopy storage capacity (to account for the tree growth which change from an average of 8m in 1/1/1993-31/12/1996 to 15m in 1/1/2007 -31/12/2011 ) and the overland flow Stricker coefficient (to account for the slower flow in the ditches as these have gradually filled in over time).
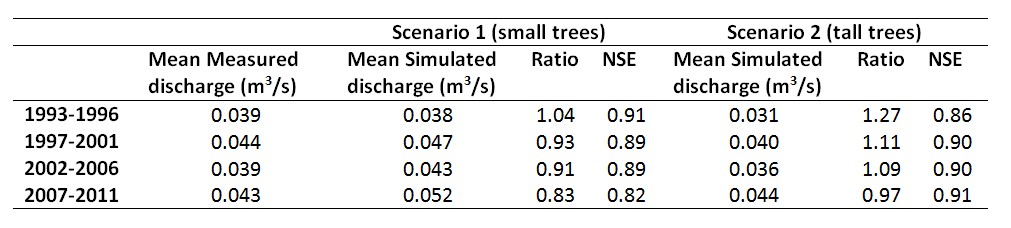
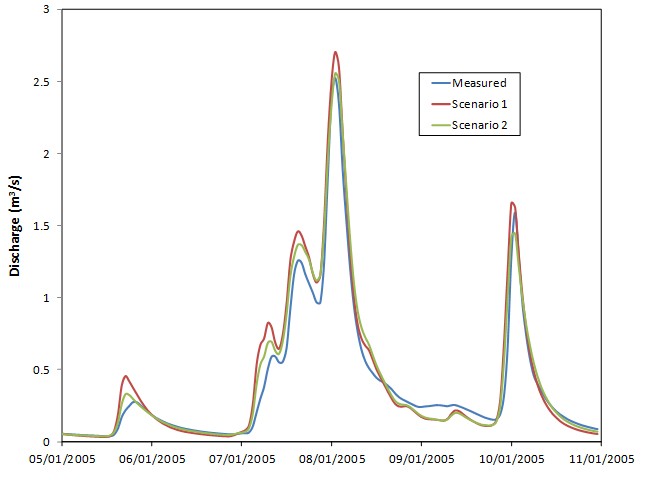
Shetran simulation results from the two scenarios for five year periods. Ratio is the measured discharge / simulated discharge and NSE is the Nash-Sutcliffe efficiency. For Scenario 1 this shows an excellent match between the measured and simulated discharge for the calibration period (1993-1996) with a Nash Sutcliffe Efficiency of 0.91 and very similar mean measured and simulated discharges. During the validation period the trees are growing but constant vegetation parameters are used in the model. This means the actual evapotranspiration is increasing and the discharge decreasing, whereas in the model the evapotranspiration and discharge are unchanged. This can be seen by the reduction in the ratio of the measured discharge divided by the simulated discharge from 1.04 in 1993-1996 (calibration period) to 0.83 in 2007-2011. As the simulated discharge is too high in 2007-2011, the Nash-Sutcliffe efficiency, as you would expect, shows a drop compared to the calibration period (0.91 to 0.82).
For Scenatio 2 the mean measured and simulated discharges are similar for 2007-2011 with a high NSE (0.91). For the earlier periods the trees are smaller and so there is less evapotranspiration and higher discharges compared to the model. This can be seen by the increase in the ratio of the measured discharge divided by the simulated discharge from 0.97 in 2007-2011 (calibration period) to 1.27 in 1993-1996. As the simulated discharge is too low in 1993-1996, the Nash-Sutcliffe efficiency, as you would expect, shows a drop compared to the calibration period (from 0.91 to 0.86).
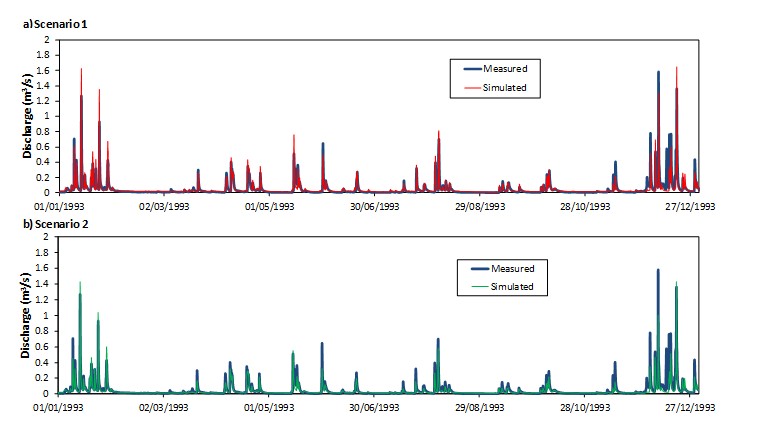
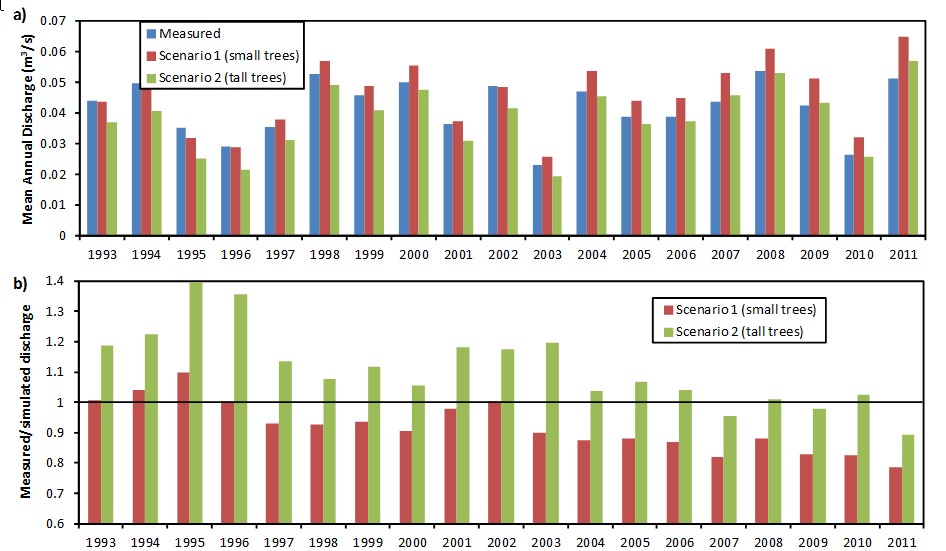
Annual measured and simulated discharges in the Coalburn catchment from 1993-2011. a) mean annual discharge, b) ratio of measured/simulated discharge These show very clearly the non-stationary catchment response as the trees are growing on the catchment increasing the evapotranspiration and reducing the discharge. In Scenario 1 the simulated and measured discharges are very similar in 1993-1996 so the measured/simulated discharge is approximately equal to 1.0 but after that there is a gradual reduction in the measured/simulated discharge ratio to around 0.8 by 2011. Whereas in Scenario 2 the measured/simulated discharge ratio starts around at around 1.2 in 1993-1996 and drops to less than 1.0 by 2011.
|
|
Send mail to
s.j.birkinshaw@ncl.ac.uk with
questions or comments about this web site.
|