![]()
|
|
|
|
Case Study 5 - Climate Change in the Yangtze Basin
BackgroundThe Yangtze River is the third longest river in the world (6418 km) and the longest river in Eurasia. Its source is located on the Qinghai-Tibet Plateau, at 5100m elevation, and extends to the East China Sea through the city of Shanghai. The River basin is managed by the Changjiang Water Resources Commission, it covers an area of 1,808,500 km2 and is home to a population greater than 400 million. Industry and agriculture within the Yangtze River basin generates 30-40% of China's GDP and the Yangtze River basin contributes nearly half of China's crop production, including more than two-thirds of the total volume of rice. The Yangtze River basin has been listed in the Global Ecoregion 200 by the World Wildlife Fund (WWF) for priority conservation, due to its rich aquatic resources. The Yangtze River has been responsible for some of China's worst natural disasters. Major catastrophic floods occurring over the last century include events in 1911, 1931, 1935 and 1954, which have claimed the lives of over 300,000 people. As recently as 1998, flooding of the Yangtze River caused over 4000 deaths, inundated 25 million ha of agricultural land, and cost in excess of $36 billion in damage to property and infrastructure.
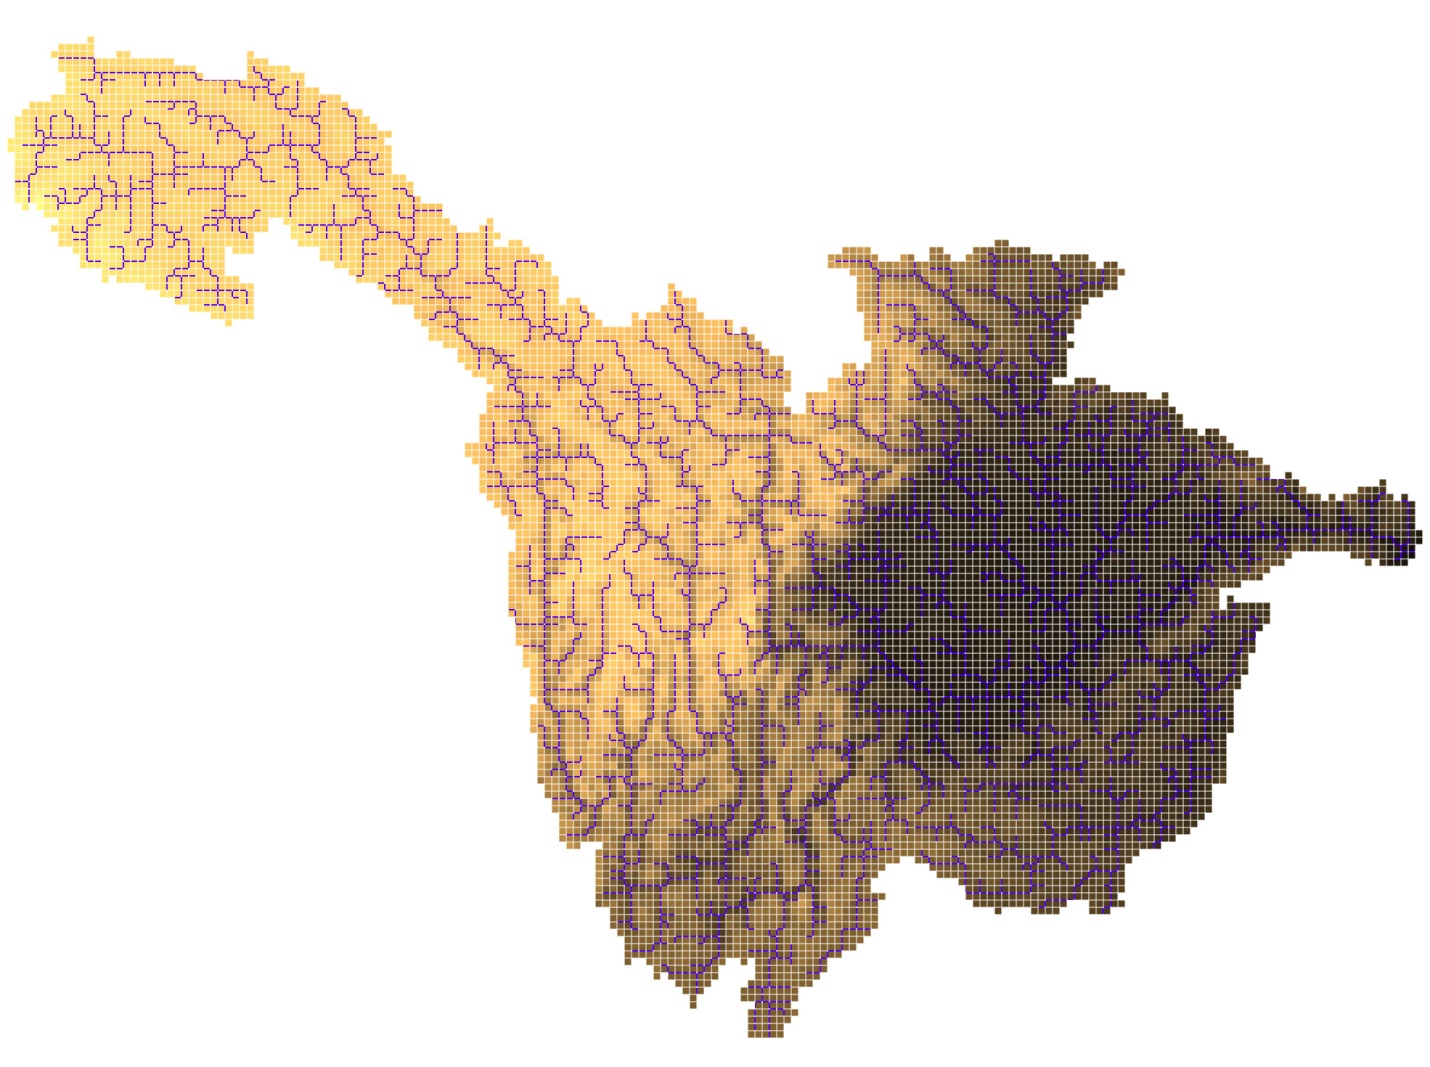
Yangtze River basin to Yichang (1,007,200 km2). Elevations range from over 5000m at the source of the Yangtze in the Tibetan plateau in the west to 65m at Yichang. CMIP5 outputs are available for each of the 2.5 degree by 2.5 degree grids numbered in the figure. In total 21 CMIP5 grids within or close to the Yangtze basin were used in this study.
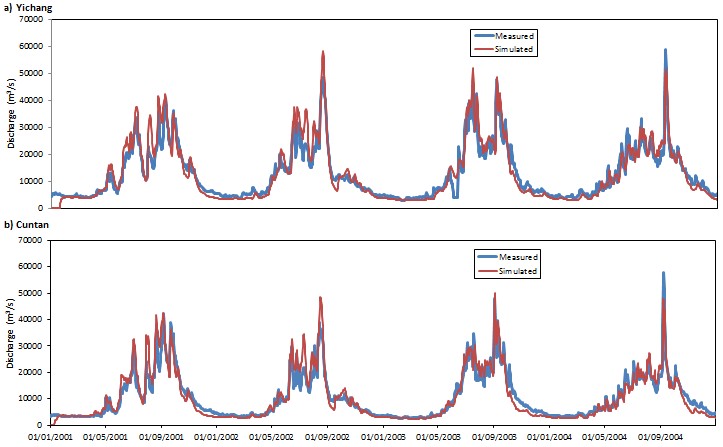
Shetran SimulationFor the Yangtze there are 10,072 vertical columns, each of which is 10km by 10km, with each column divided into up to 25 finite-difference cells (making a total of around 250,000 finite difference cells). River channels are specified around the edge of the finite-difference columns with 4143 river channel sections specified. A standard split sample calibration/validation was carried out for the Shetran simulation. The calibration was for 2001-2002 and the validation period for 2003-2004. There is an excellent match between the simulated and measured daily discharge at both Cuntan and Yichang, with a Nash-Sutcliffe efficiency (NSE) of 0.85 at both sites for the calibration period from 2001-2002 and of 0.92 at both sites for the validation period from 2003-2004.
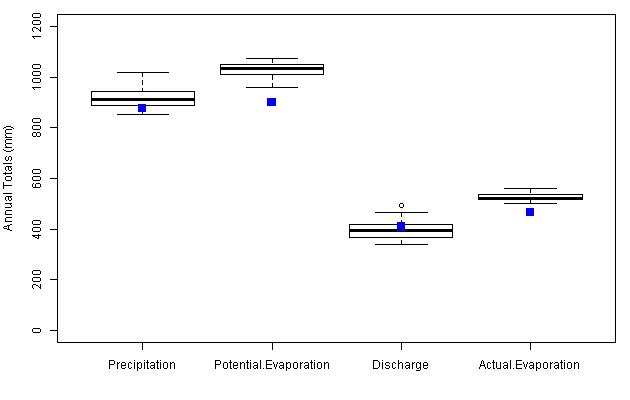
Future Climate simulationsTo analyse the effect of climate change on river discharge, simulations were carried out using 78 climate model projections from CMIP5 for the Representative Concentration Pathway (RCP) 8.5. Downscaling was done using monthly change factors, calculated between 1980-2010 and the 2040-2070. The precipitation projections show a big spread, with changes in the basin's annual precipitation varying between -2.6% and +16.2%. Increases in temperature and consequently evaporation were projected by all models, resulting in changes in the annual basin's discharge between -17.0% and +21.1%. Also, the basin is very sensitive to changes in precipitation with a 10% change in precipitation producing a 16.9% change in annual discharge.
Box plot showing the range of simulated precipitation, potential evaporation, discharge and actual evaporation over the 78 CMIP5 future climates. The simulated discharge for the current climate is shown by the blue square.
|
|
Send mail to
s.j.birkinshaw@ncl.ac.uk with
questions or comments about this web site.
|