![]()
|
|
|
|
Case Study 3 - Wetland Inundation
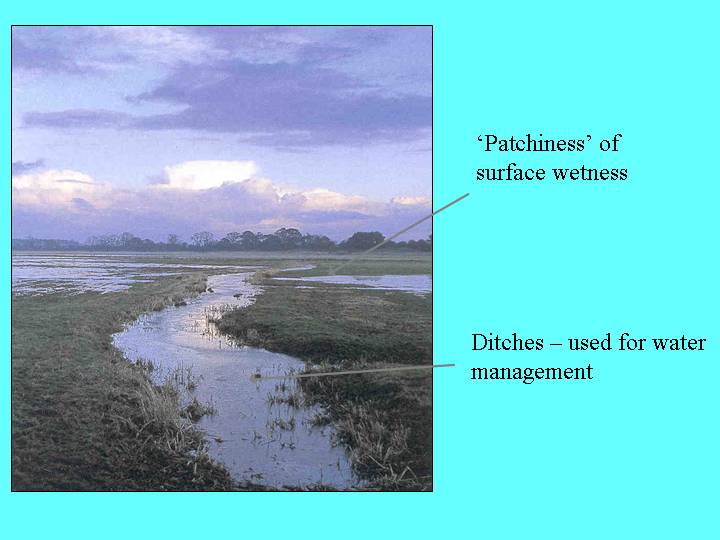
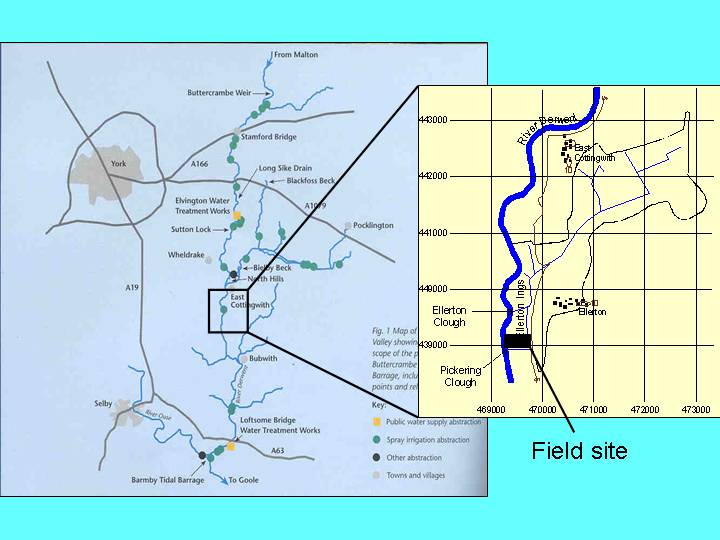
BackgroundThe Ellerton Ings site is located within a 20 km lower section of the River Derwent in Yorkshire, UK. The Lower Derwent Valley is characterised by a slow flowing river meandering through a flood plain of about 1km wide. The flood plain is effectively divided in to a number of discrete hydrological units (known as Ings) by sets of main drainage ditches. Ellerton Ings is situated in the southern central part of this area, and is about 0.49 km2 in area. The site is typical of the study area, holding high numbers of waterfowl in the winter and spring. The soils are predominantly fine textured alluvial clays of very low vertical and horizontal hydraulic conductivities, and consequently lateral drainage predominates within the upper soil horizon or as surface run-off. Flooding within the floodplain is of regular occurrence in the winter and spring months, and is mainly due to the high river levels preventing the ditches discharging into the river. The water related issues are concerned with the agricultural utilisation of the grasslands for hay and grazing and nature conservation on the flood plain, and navigation, water abstraction, flooding and nature conservation in the adjacent river.
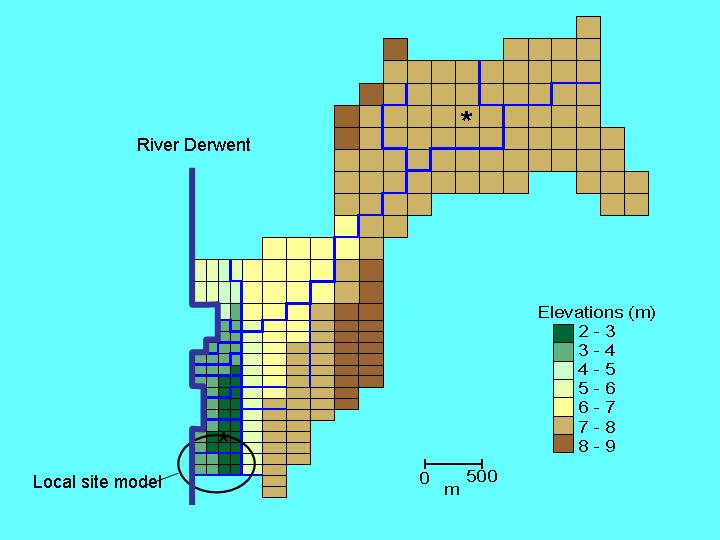
SHETRAN ModelA SHETRAN model was set up for the full catchment feeding into Ellerton Ings, and a nested model was set up for the field site. The figure shows the finite-difference grid for the full catchment model, showing mesh refinement in the region of interest on the floodplain. The boundary conditions for the field model are taken from the ditch levels simulated by the full catchment model. Results are given for the local field model.
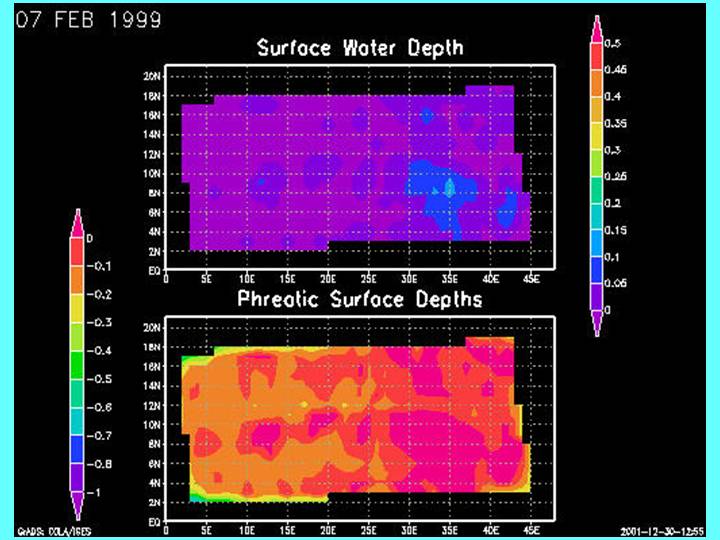
ResultsThe image shows a snapshot of the transient results from a SHETRAN simulation of the Ellerton Ings field site. The top part of the image shows surface water depths, and the bottom part shows phreatic surface (water table) levels. At this site, there is no true water table, so the data indicate depth to full saturation of the soil. The 'patchiness' of the saturation can clearly be seen, related to the surface microtopography and the history of inundation. At this time (7 Feb 1999) there is an area of ponding, indicated by the blue region in the top image, and there are areas of near-saturation in the soil, indicated by the pink areas in the bottom image. The saturation is caused by two processes: direct rainfall input, and overtopping of the drainage channels. The rainfall events tend to produce only small areas of inundation. The overtopping events produce short durations of extensive inundation, followed by rapid drainage back into the channels, again leaving patches of wetness. These remaining patches disappear very slowly, due to evapotranspiration and some slow subsurface drainage into the channels.
|
|
Send mail to
s.j.birkinshaw@ncl.ac.uk with
questions or comments about this web site.
|