Recent Hydrometric Data
Why monitor the catchment?


- Rural catchments, such as the Haltwhistle Burn catchment, are poorly understood;
- To understand how the catchment’s watercourses respond during and after rainfall events and how this might affect other catchment issues (e.g. water quality);
- We have traditional monitoring equipment in place so that the PhD research project can compare this type data to that collected by the community to determine how far we can rely on ‘community monitoring’ for catchment management purposes.
All river level and rainfall data collected using traditional and automatic monitoring equipment (up to December 2014):
You can view all of the data collected and processed so far using the interactive maps and plots below. Hover your mouse over the map or graph, look for the '+' signs and then click on them for points of interest. Use Google Chrome on a computer for best results (rather than a smaller mobile device).
1. View river levels and rainfall data by location across the Haltwhistle Burn catchment:
2. View river levels and rainfall data over time (January 2014 to December 2014):
A quick summary of the above river level and rainfall data:
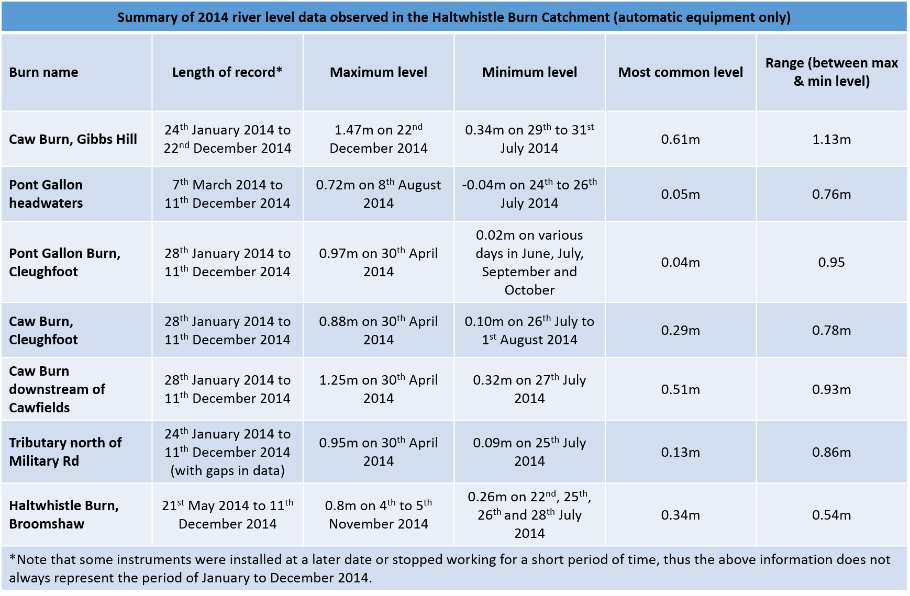
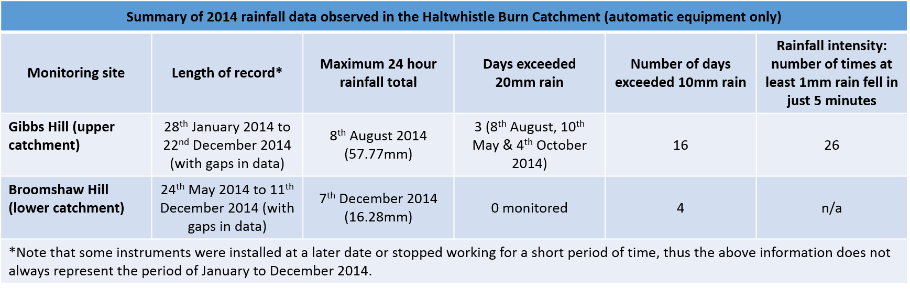
Remember... all of the data collected and presented here has been observed using automatic monitoring equipment.
- Take a look at the data collected by members of the community (a citizen science approach).
- Take a look at the Flickr album see what the automatic monitoring equipment looks like ![]()
