WT1: Baseline Scenarios
Work Task Description:
Work Task 1 aims to identify and specify data needs for CADTIME, in order to provide a detailed understanding of baseline emissions, processes and exposures from the main sectors contributing to Delhi’s air pollution. The main sectors we are focussing on are transport (especially real world exhaust emissions of traffic reported), industry, power generation, domestic, fugitive dust, agriculture (especially crop burning), construction and solid waste burning.
It is essential to understand not just what sectoral activities are contributing to these, but also the user activities (or behaviours) associated with them, in order to effectively devise and target management and interventions (e.g. what is the division of transport between travel to work, business, education, recreation/leisure, goods traffic etc., what domestic emissions are associated with space heating/cooling, water heating, cooking etc., what is power generation providing power for?).
Work Task 1 is also working very closely with key partners (NEERI and CRRI) to gain local understanding of the emissions from the key sectors, and what the priorities and barriers are in terms of reducing emissions.
Current Activities:
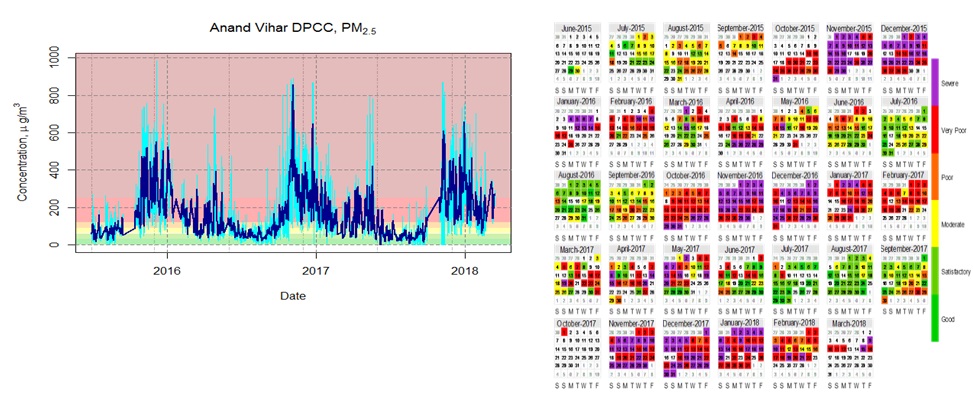
In Newcastle (UK) the initial activities for Work Task 1 have involved the collection and review of a large body of literature on the current air-pollution situation within Delhi, as well as analysis of pollution concentration information (primarily associated with particulate matter) collected from monitoring sites across Delhi and the NCR territory. These data have been provided centrally by the Central Pollution Control Board (CPCB), acting on behalf of other agencies, such as the Delhi Pollution Control Committee (DPCC) or the Indian Meteorological Department (IMD)/System of Air quality Forcasting And Research (SAFAR). The picture below shows a sample time series analysis for a particular station in Delhi on the left, and the associated temporal pattern of concentrations, presented as a calendar plot on the right. These images have been generated using the openair suite of tools for the R-programming language.

At IITMadras, attention has been focused on two strandsof CADTIME: Collection of real-world emissions data from vehicles operationg within the Delhi fleet, and development of suitable modelling techniques and emissions inventories to drive the analysis of the current situation, as well as drive future scenarios in later Work Tasks.


