Outputs
Outputs from UHTIMv2 include greenhouse gas emissions (GHGs: uCO2), local air quality emissions (LAQs: NOx, NO2, PM10, PM2.5, HCs), noise levels and axle loadings on roads. GHG and LAQ impacts being expressed as ‘mass emissions’ (i.e. grams, kilograms or tonnes of pollutant), noise being represented by a nominal roadside equivalent A-weighted sound level (LAeq) and road damage being expressed in Equivalent Standard Axle Loadings (ESALs). For air pollutants and ESALs, total emission values are given for both the ‘Baseline’ and ‘Site Active’ scenarios.
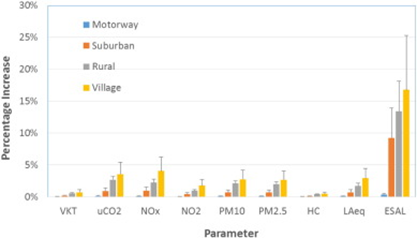
The figure below (Figure 1), taken from the Environment International article, demonstrates a ‘Baseline’/’Site Active’ comparison, in terms of percentage changes in pollutant totals, from a model of a six-well pad, developed over an 85-week period to completion, with all incoming and outgoing demands handled by tanker traffic. The type of road used to access the site makes a major impact on the relative increase in emissions. The selection of the length of the baseline period can radically alter the apparent increases in emissions (e.g. selection of the baseline over ‘initial pad development to well completion’ will give relatively larger increases than over ‘initial pad development to decommissioning’).

Figure 1. Percentage increases over baseline values for vehicle kilometres travelled, GHG and LAQ pollutants, noise and axle loading, assuming six-well pad operation using differing road types. Vertical bars show the difference between the ‘low-water use’ and ‘high-water use’ scenarios.
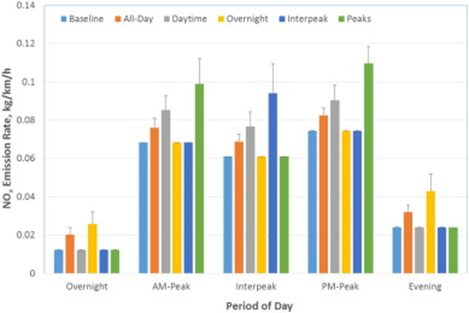
The ‘overall’ picture presented in Figure 1 does not reflect the fact that the intensity of operations may result in short-term, transient air quality issues. The greatest intensity of operations may be experienced during a well frack, when water demand is high over a period of several weeks. Figure 2, again from the Environment International article, demonstrates how the TIM can model changes in (NOx) emission rates, during a short-term event, based on site access policy.

Figure 2: Peak operational NOx emission rates compared to the baseline profile under differing vehicle arrival and departure policies.
For all outputs, totals may be broken down to the hourly level. This resolution is suitable for use in other models – e.g. for pollutant dispersion modelling in an appropriate, third-party package such as ADMS-Roads.


