WP1: Extreme Events
Clustered processes: Superstatistics
Contact: Christian Beck c.beck@qmul.ac.uk Pau Rabassa p.sans@qmul.ac.uk
This work package employs novel techniques from the theory of stochastic processes, extreme value theory and nonlinear time series analysis to better understand the clustered statistics of flooding events. A recent investigation within the FloodMEMORY project uses so-called superstatistical techniques for an analysis of historical time series of sea level fluctuations (non-tidal residuals) measured at various coastal locations in the UK (Rabassa and Beck 2014). Ultimately WP1 aims to analyse a variety of historical time series with the aim of specifying stochastic models that reproduce the higher-order statistics of the underlying stochastic processes at multi-timescales. The results can be used to develop new simulation tools and to improve existing ones. First, the relevant temporal scales on which the extremes fluctuate will be established, including an analysis of systematic variation due to e.g. climate change. Given those time scales the corresponding probability densities of the relevant parameters will be extracted. This information, together with a multi-scale analysis of correlation functions, will be used to construct optimized point process models and generalized stochastic differential equations with memory kernels that generate spatio-temporal stochastic processes with the same higher-order statistics as the observed data. On the practical side, the project intends to develop novel quantitative measures of clustering. Also, better risk estimates of successive flood events will be obtained, a better understanding of the various time scales and relaxation times involved will be obtained, and analytic results for some simplified models will be determined.

P. Rabassa and C. Beck, Superstatistical analysis of sea level fluctuations, Physica A (2014), in press
The Newlyn Tide Gauge
Contact: Matt Wadey m.p.wadey@soton.ac.uk
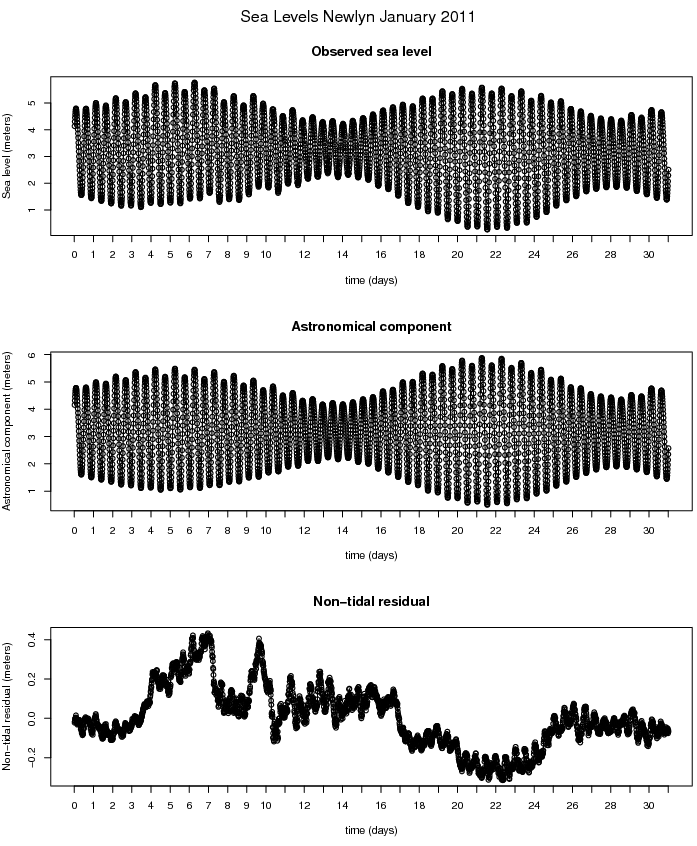
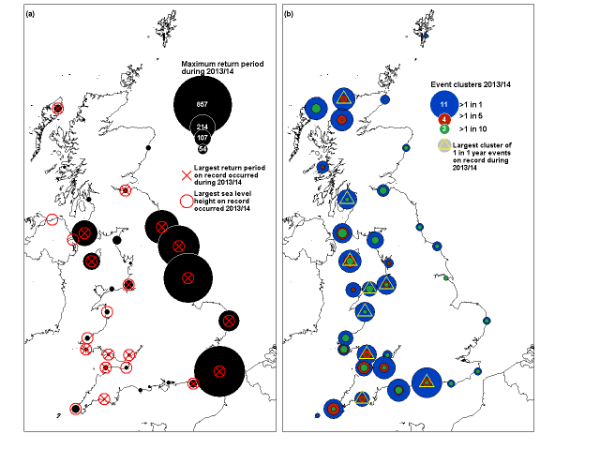
At Southampton, we have published in the journal ‘Ocean Science’ an assessment of the near 100-year tide gauge record at Newlyn. This highlights extreme sea level event clustering, and evaluates whether the 2013/14 winter was more extreme than previous winters (and we extended this to the other ~40 sites around the UK – see the figure below). We also used the same data sets to calculate different types of storm-tide time series that are associated with extreme sea level probabilities around the UK coast (Quinn et al, 2014), which will be complementary to further modelling work relevant to clustering. At the moment we are continuing our assessment of clustering and extremes (including the 2013/14 winter) with a detailed case study of the Sefton coast (same authors as the Newlyn paper, see below). This includes waves as well as sea levels; and will be submitted to the EGU Journal “NHESS special issue - Monitoring and modelling to guide coastal adaptation to extreme storm events in a changing climate” on 1 December 2014.
The group at Southampton and Queen Mary have met to discuss and start work on a joint paper “Generating realistic time series of extreme sea levels that include storm clustering for flood risk assessment”. We intend this to bring together elements of both institutions (and the knowledge of Kilsby and Serinaldi at Newcastle) to enable the generation of cluster time series to drive further analysis of the impacts of clustering under present-day and changing (climate and sea level) conditions.

The methods applied at Newlyn are extended to the UK’s Class A tide gauge sites (for which both return periods and 2013/2014 sea level time-series are available); (a) the largest return periods during the July–July 2013/2014 yr (note that the return period dataset does not cover Bangor, Portrush and Jersey); (b) clustering of events above the 1 in 1 yr return period threshold. (Wadey et al., 2014)