
Projects
Visualising data profiles and analysis pipelines
Analysts and researchers face major hurdles understanding the quality of their data and the knock-on consequences of the choices they make during one stage of data processing on those that follow. Data visualisation offers many benefits that could help analysts and researchers to overcome those hurdles. This project investigate how visualisation techniques are and should be exploited for key aspects of data profiling.
This project, funded by the Alan Turing Institute, aims to characterise the way in which analysts and researchers profile data and design data processing pipelines. This is important in order to understand the limitations of current profiling and pipeline design methods, the barriers that analysts and researchers face, and the ways in which visualisation techniques could be transformative. The project engage with public and private sector analysts and researchers, aiming to identify quick wins, share best practice and develop a research agenda for the adoption of visualisation techniques in data profiling and pipeline design. The primary measure of success will be organisations beginning to adopt the techniques that are proposed, to make their profiling and pipeline design more rigorous and efficient. This is a catalyst for more scalable and higher quality data science.
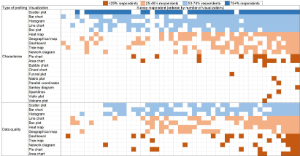
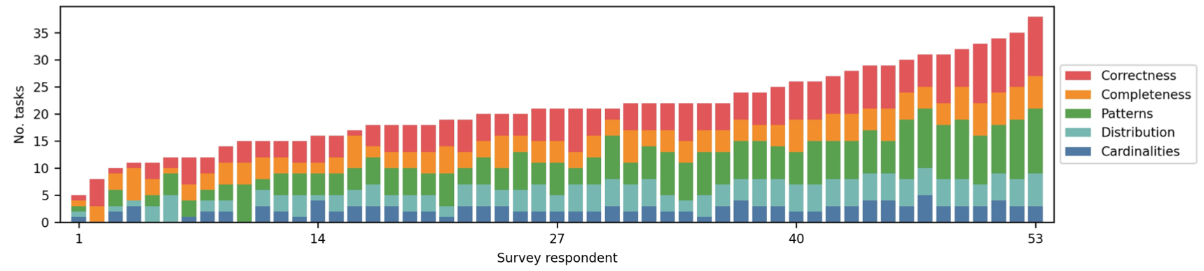
The use of good-quality data to inform decision making is entirely dependent on robust processes to ensure it is fit for purpose. Such processes vary between organisations, and between those tasked with designing and following them. In this project 53 data analysts from many industry sectors were surveyed, 24 of whom also participated in in-depth interviews, about computational and visual methods for characterizing data and investigating data quality. Through this a list of data profiling tasks and visualization techniques was compiled which is more comprehensive than those previously published. Furthermore, the results highlight the diversity of profiling tasks, identify unusual practice and exemplars of visualization, andprovide recommendations about formalizing processes and creating rulebooks.
Project team
Professor Roy Ruddle (PI), University of Leeds r.a.ruddle@leeds.ac.uk
Dr Sara Johansson Fernstad (Co-I), Newcastle University sara.fernstad@newcastle.ac.uk
Professor James Cheshire (Co-I), UCL james.cheshire@ucl.ac.uk
Last modified: Tue, 08 Nov 2022 12:23:01 GMT