GIS Mapping of demographic data in St Martin in the Fields
Contents
A GIS solution to mapping in the early modern period?
Mapping the distribution of baptisms
Mapping the distribution of baptism fees amongst the Family Reconstution Population
Mapping diseases in the eighteenth century
A GIS solution to mapping in the early modern period?
One of the aims of the Wellcome Project, and the second ESRC Infant Mortalty Project was to map patterns of disease onto maps of the built environment. However, maps of urban areas before the Ordnance survey commenced are difficult to use for this purpose. It was rare for contemporary maps to depict individual plots and properties, and still rarer for sources to give specific street level addresses. To overcome this problem, working with Dr Stuart Basten and Dr Max Satchell the Project has now produced some preliminary GIS maps of the parish. This will enable us to map different causes of death by street at select points in the eighteenth and nineteenth century.
In essence, Ordnance Survey maps have been been translated onto contemporary maps drawn in the eighteenth and early nineteenth century. Each street or area is depicted as a unique polygon on the map. The technique is well suited to relatively large urban areas, where the number of individual streets is large. In St Martin's there exists voluminous street level data, and this has been linked to the relevant polygon. It is of course also important to depict blank polygons, ie. streets that did not contribute demographic data. Such areas are given 0 values. They sometimes indicate the presence of government offices, churches and other non residential areas. The GIS technique adopted also meant that the physical area of each residential unit could be calculated, thus enabling a rough and ready calculation of density per square metre.
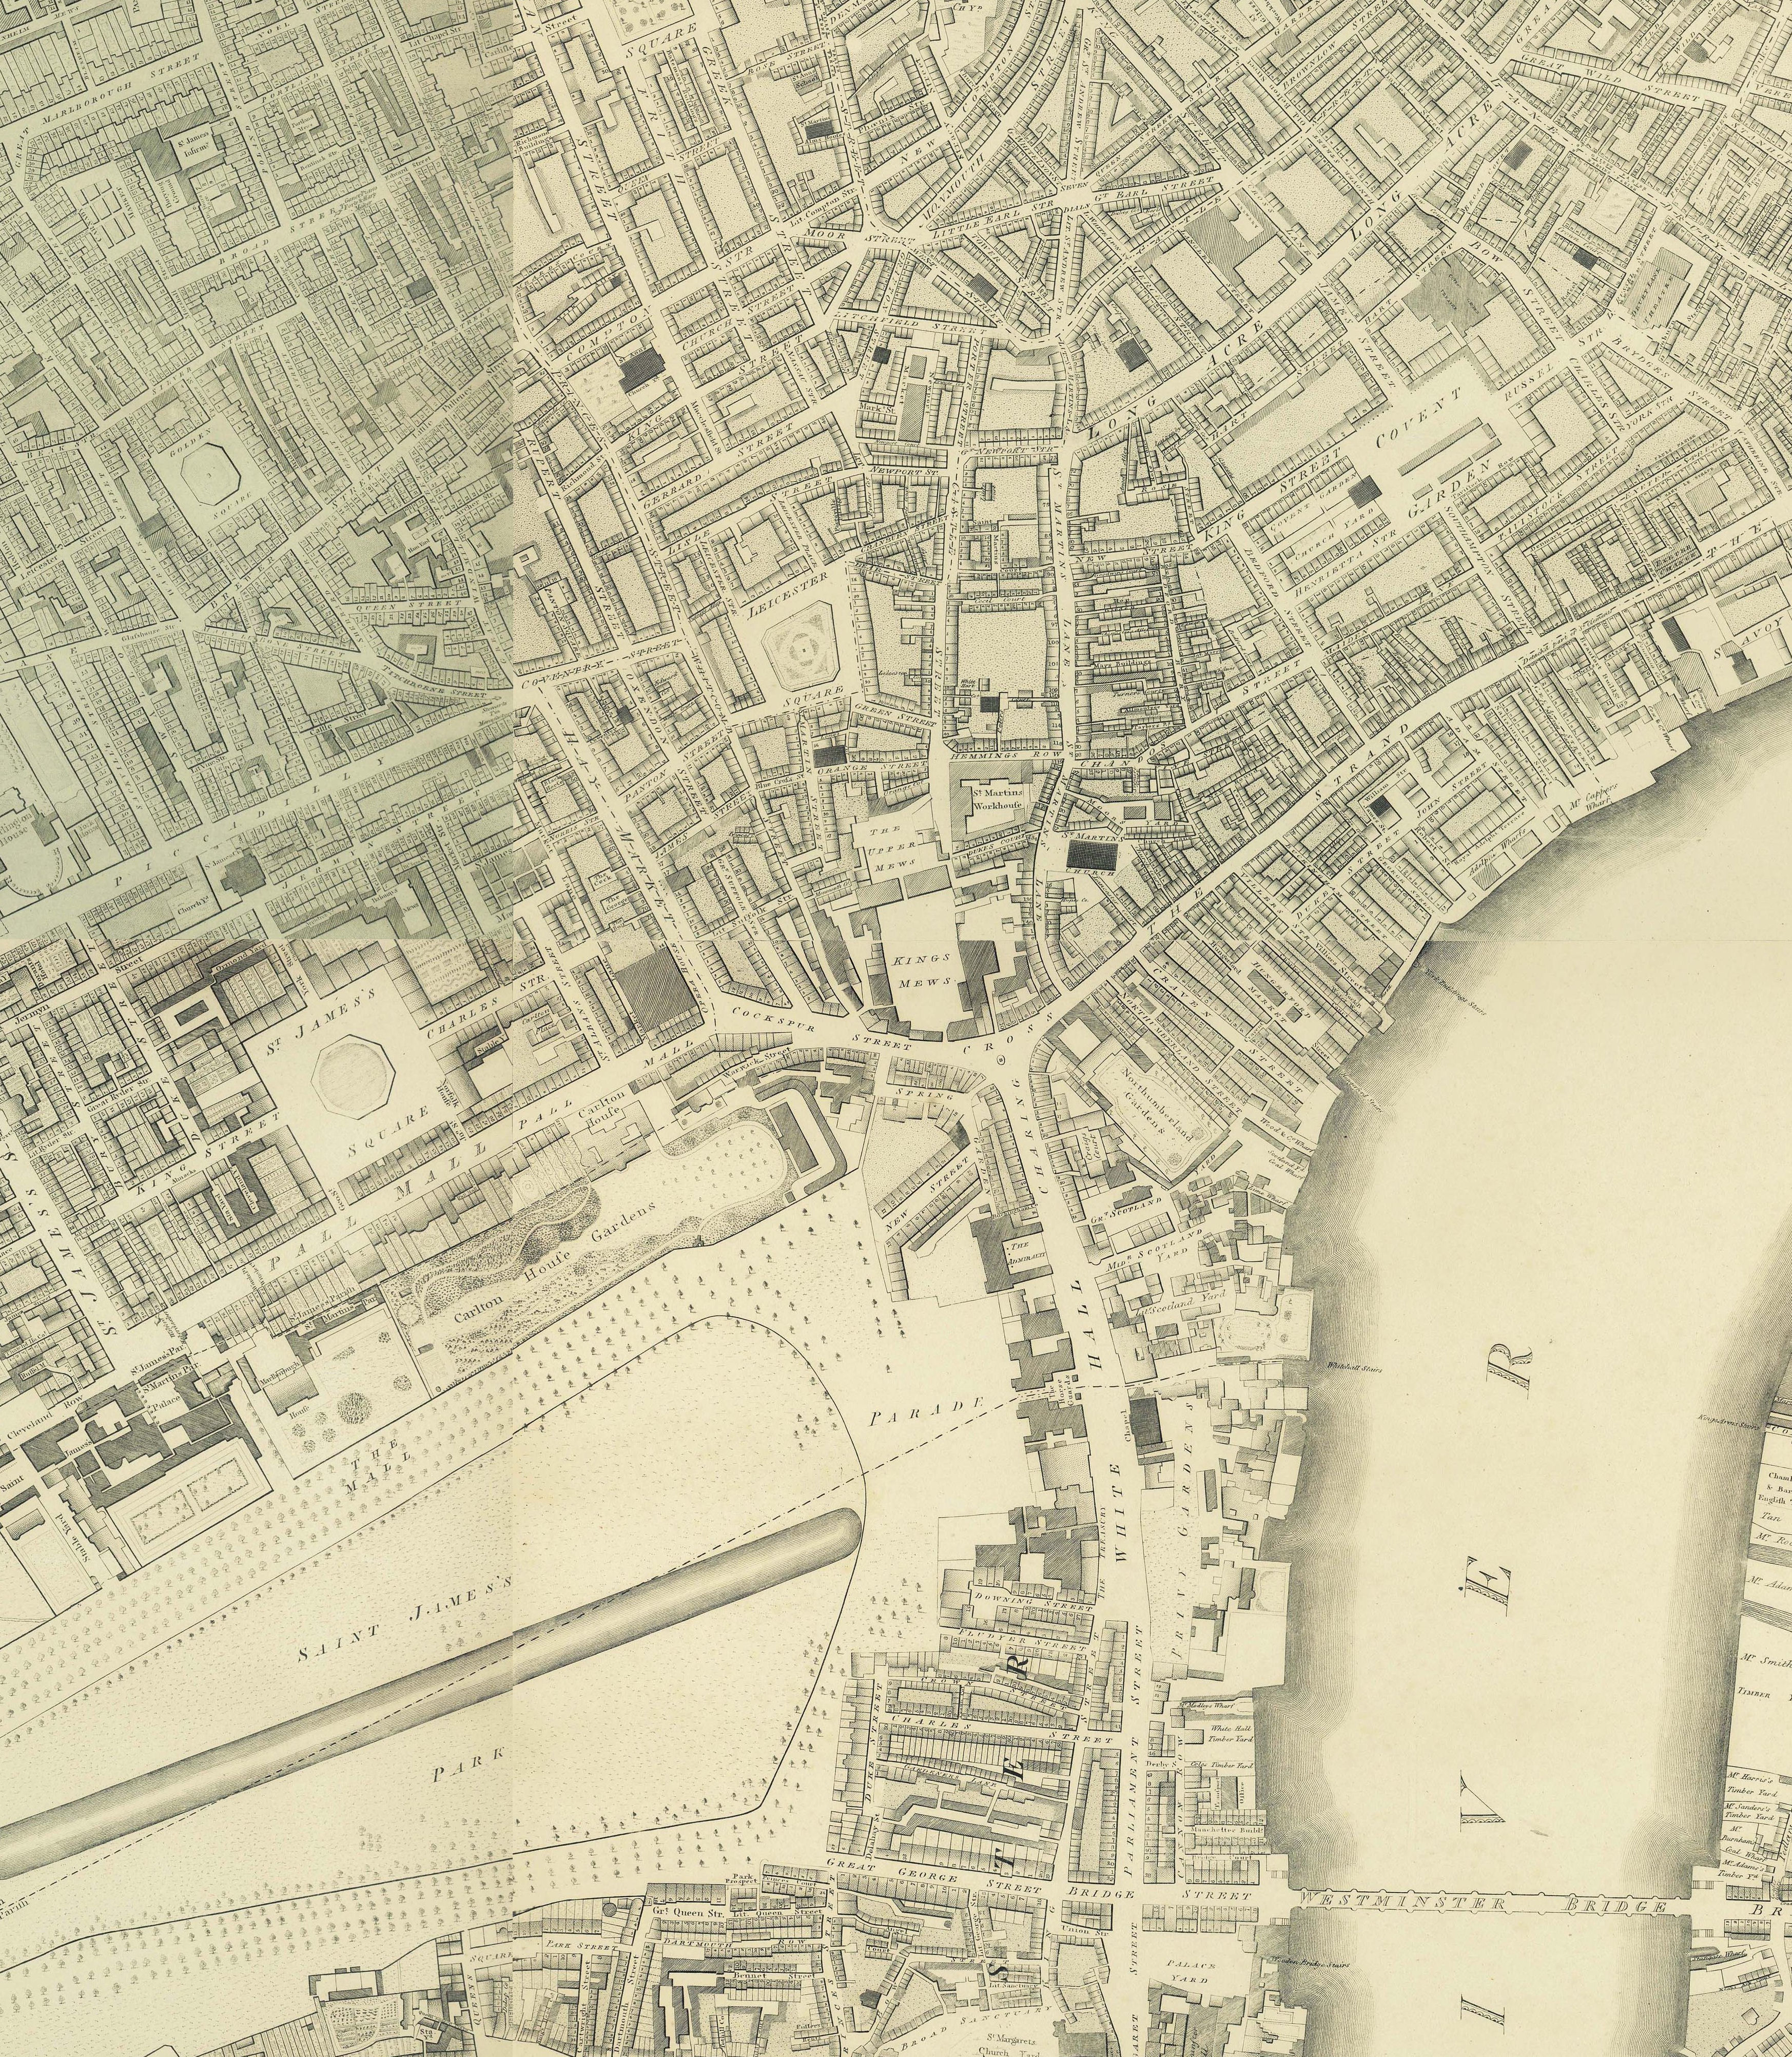
Once the polygons have been constructed there is a wealth of data which can be mapped at street level. To aid interpretation, the very detailed Horwood map (mapped to a scale of 26 inches to a mile) of 1799 is displayed below. This corresponds to the polygon maps. Clicking on the map will generate a larger map of higher resolution which will open in a new window. This larger map will take users to the level of street and house. Details about individual streets (and notable occupants) can be found in the online edition of the three-volume Survey of London of the parish of St Martin in the Fields. Vol 1 covers Charing Cross, Vol 2 The Strand and Vol 3 Trafalgar Square.
Clicking on the map will generate a larger map of higher resolution
Social status mapping in the eighteenth century
Street mapping by rateable values
Before embarking on mapping diseases, one can use the available data to look at the distribution of wealth and poverty across the streets, lanes, courts and alleys of the parish. It is obviously necessary to do this before mapping disease patterns. It should be stressed that social status indicators for a whole population at street level is not normally accessible in eighteenth-century sources. Even the exceptionally fine coverage of wealth and poverty found in late seventeenth century taxation assessments often omit whole categories of the poor. Mapping wealth and poverty data is important, however, because it might tell us something about the extent to which the urban topography exhibits 'social zoning' during the eighteenth century, something that is thought to have been widespread in London's West End. We need to know this in order to interpret the mapping of demographic data correctly.
The first exercise uses rateable values listed in poor rate books, mapped onto the year 1799. These can be mapped in different ways (by rate band, by density per acre etc). The problems of interpretation are far from insignificant, given that large numbers of families did not pay rates, either because their houses were not considered able to support a rating, or because they were lodging in other people's houses and were not thought to be liable. A particularly useful map shows the percentage of ratepayers occupying property rated at £50 or more in each polygon. This is a reasonable measure of the distribution of wealthy householders across the parish. The wealthiest districts (top two categories where more than 25% of ratepayers paid £50 or more) were found in the southern parts of the parish, along the Strand and in prestigious lanes running off the Strand down to the river. The two other notable thoroughfares in the parish, St Martin's Lane and Long Acre, in contrast were significantly more humble districts, precisely as one might expect. The south of the parish contained government offices, military establishments and part of the Palace of White Hall.
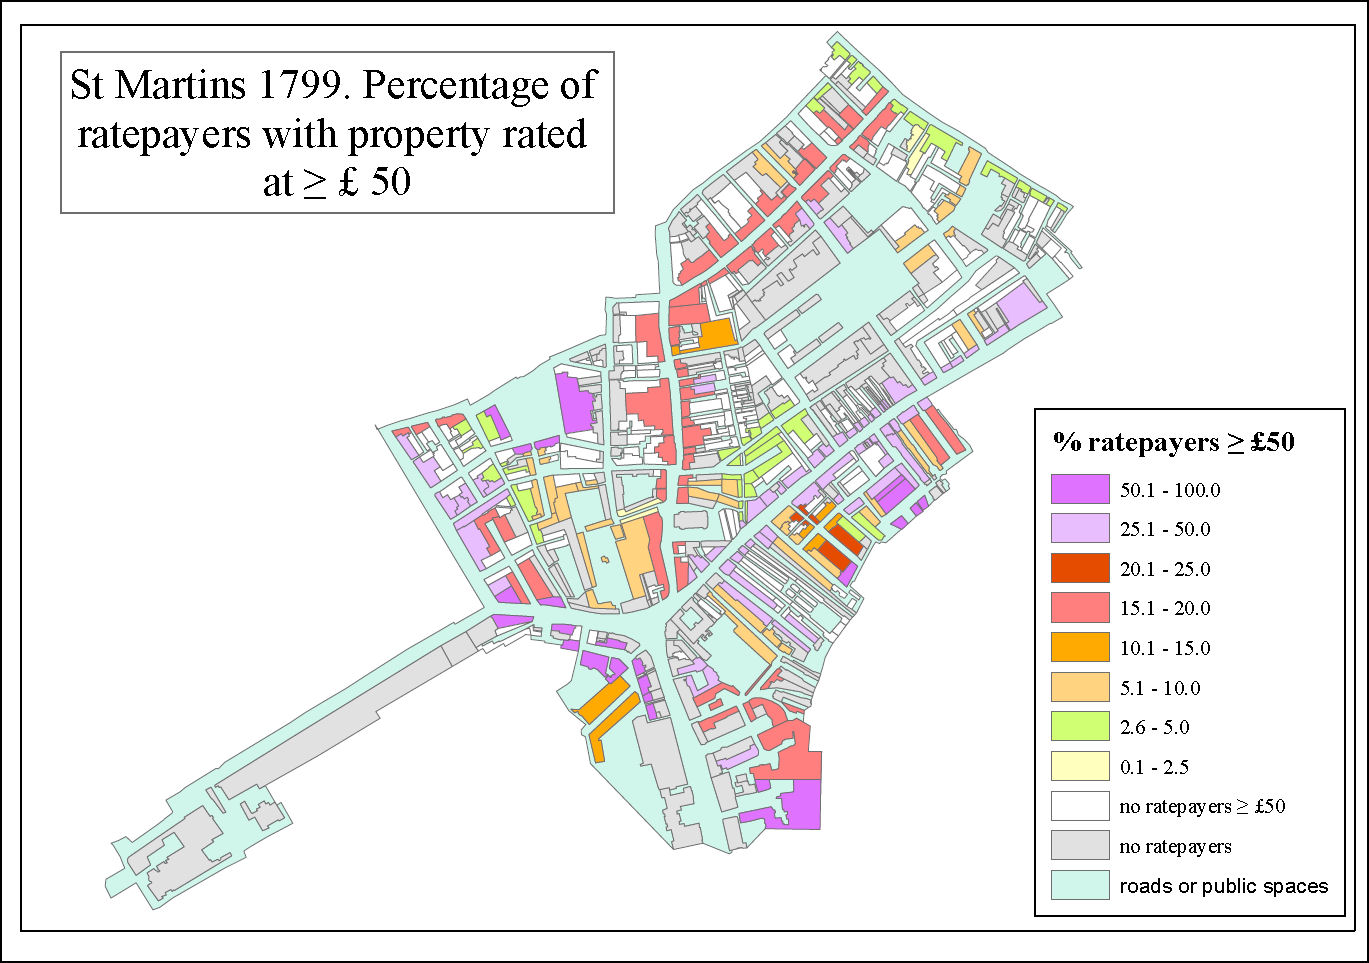
Clicking on this map loads a larger resolution pdf version
The residential distribution of baptisms in the study area
Since the Baptism Fee books supply street addresses it is possible to display these onto our GIS maps. One reason for doing this is to establish which streets contributed the largest share of baptisms, which is crude proxy measure of the distribution of the local population. The measure adopted is the number of baptisms per acre - a reasonable measure of population density made possible by the GIS mapping process. The figure below is intriguing, if difficult to interpret without detailed work at the very local level.
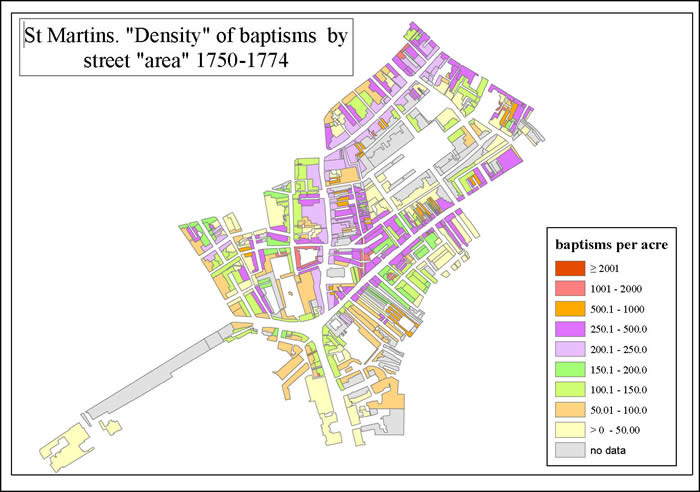
Clicking on this map loads a larger resolution pdf version
Mapping the distribution of baptism fees: the residential distribution of wealth and poverty amongst the Family Reconstution Population
These two maps display the residential distribution of baptism fees for the reconstituted families only. Here each family has been allocated to a particular class of fee based on the typical fees that they were charged. This procedure helps to eliminate distortions caused by those occasionally excused fees, or given a reduction in fees by the parish in recognition of past service or sometimes as a consequence of exceptionally elevated social status. The first map displays districts according the percentage of reconstituted families typically paying 100d or more for baptism fees - the highest category. The second map displays districts according the percentage of reconstituted families excused baptism fees on the grounds of poverty, those, in other words, considered paupers. As with the rateable value mapping, there is a (pleasing) correspondence between the residential distribution of the wealthiset ratepayers and those paying the highest baptism fees. Once again the Strand and southern parts of the parish appear to have disproportionately contained wealthy inhabitants, and (unsurprisingly) had relatively few paupers living there. There were some pockets of real poverty in the parish. Apart from the workhouse, there were small pockets of streets with high proportions of pauper families dotted around the parish, particularly to the west off Drury Lane and around Covent Garden. The river area is particularly interesting, since it appears to have discrete areas of very wealthy and poor in close proximity to each other.
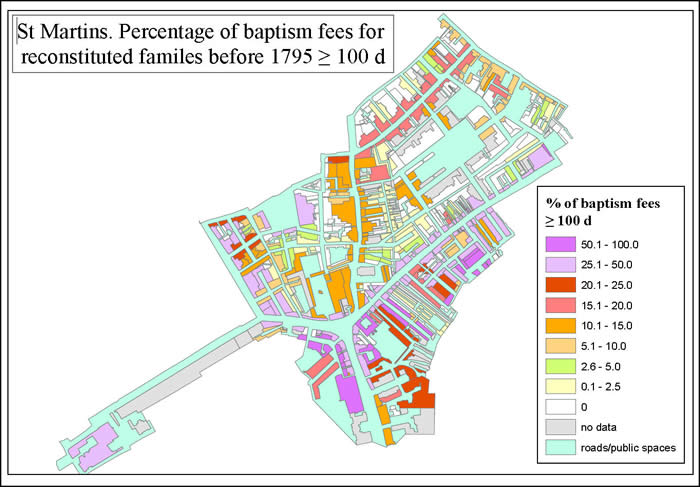
Clicking on this map loads a larger resolution pdf version
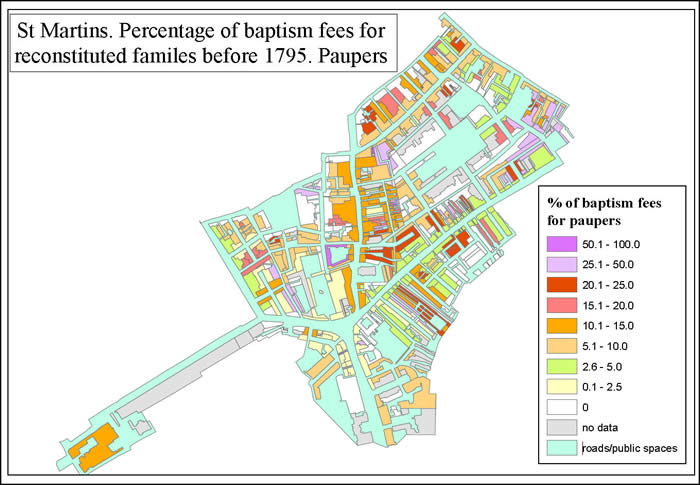
Clicking on this map loads a larger resolution pdf version
Mapping fatal disease in the eighteenth century
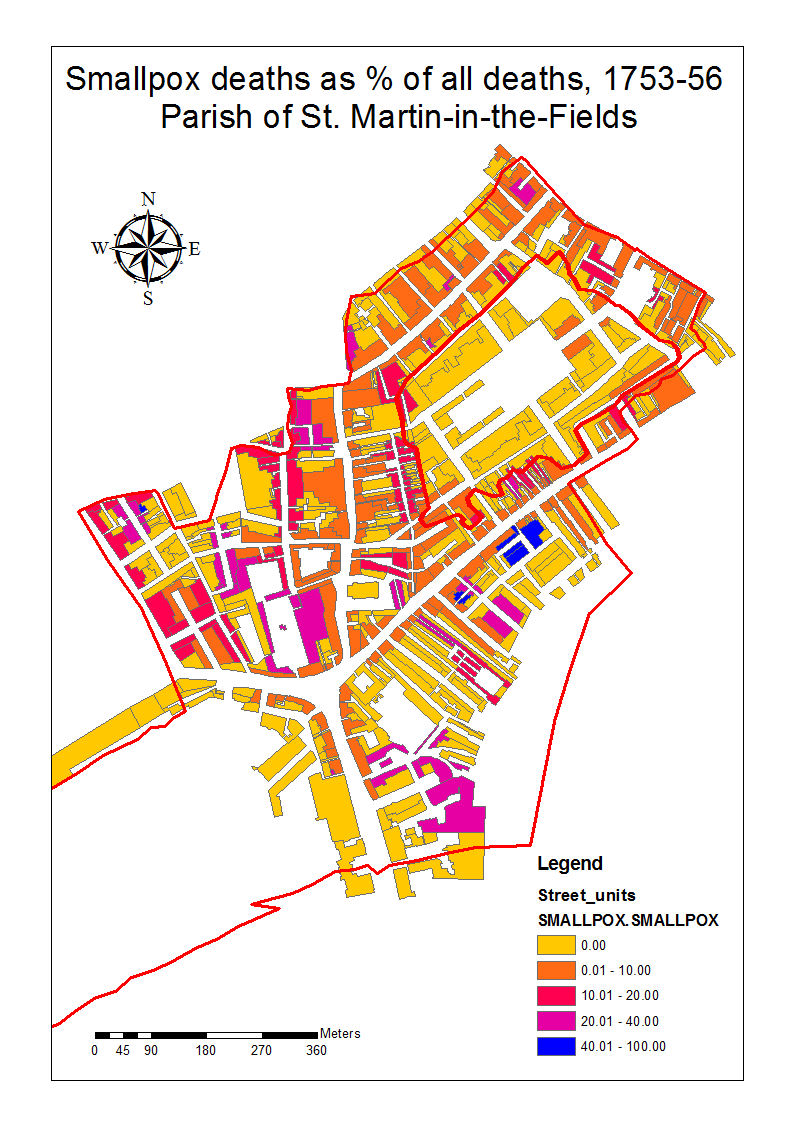
As an illustration of the power of this innovative approach, take a look at this new GIS map of smallpox deaths during 1753-56 in St Martin's. On the map Charing Cross is the hub, from which St Martin's Lane runs north and the Strand runs north east. Note that the figure sets out the percentage of smallpox deaths out of all deaths from the street, lane, yard, court or alley depicted on the map in the period in question. This helps to control for the population at risk, which is not known for this period. All yellow 'polygons' had no smallpox deaths registered between 1753 to 1756. Blue areas depict those few districts where 40% or more of all burials were stated to have died of smallpox. Thanks are due to Dr Stuart Basten who constructed the figure below. There are relatively few burials, of course, from the parish of St Paul's Covent Garden, which was an enclave, surrounded by St Martin's parish on all sides.
 .
.
This website is maintained by jeremy.boulton@ncl.ac.uk