NOAH 1D Screenshots


The NOAH Windows Workbench

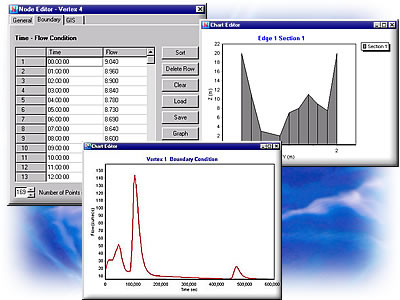
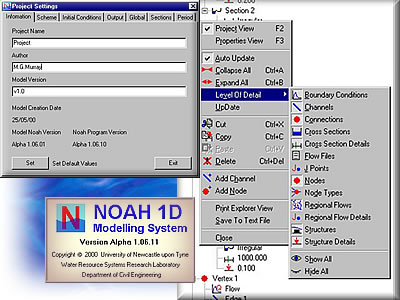
NOAH has a full Windows based workbench for fast data entry, checking and editing

Open and closed channel systems containing loops, branches and floodplain storage or conveyance can be modelled

Numerous hydraulic objects including culverts, weirs, pumps, losses and various boundary types are supported

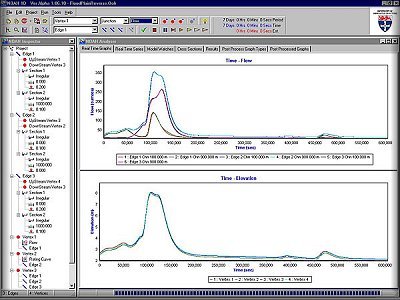
NOAH's unique Object Oriented programming technology enables real time animation of results during flow simulations

NOAH main screen


The NOAH graphics engine

NOAH's powerful graphics engine enables plotting of geometry and results in cross-sections, longitudinal profiles and result animations

Initial and steady state conditions are generated and optimised automatically by NOAH prior to unsteady simulations

Inflows can be entered at a point source or be spatially discrete over specified areas of the model domain

Results can be exported in a variety of tabular text files for import into spreadsheet packages, or NOAH can perform its own statistical analysis


Assisted model setup

The NOAH Wizard guides the user through model construction and data entry procedures

When data entry is complete the NOAH Wizard checks the model for errors prior to running flow simulations

The NOAH GIS Wizard enables the automatic creation of channel and floodplain sections from 3D digitial terrain datasets (DEMs/DTMs)

In addition water surface profiles from flow simulations can be exported direct to GIS for map generation


Back to top | NOAH home | Features | Requirements | Leaflet | Download | Contact | WRSRL

NOAH workbench Hydraulic Objects menu Real time graphing of water surface elevation at selected locations Real time graphing of flow at selected model locations Objects menu Real-time graphing of water surface elevations at selected cross-sections Real-time graph of flows at selected cross-sections Hydraulic Objects menu for fast and simple data editing Splash screen NOAH Wizard for guided model construction Data entry screen for boundary conditions Cross-section graph Boundary conditions time-series graph